Arth Script is the indicator language of Charts by Arth, the chart engine shared by QuantPower and Arth.live. It comes in two forms. A formula is one line of plain maths on the chart's prices, such as ema(close, 9) - ema(close, 21), and an indicator holds one to three of them. A script is a few short lines with inputs, plots, panes and alert conditions. You can write either yourself, or describe what you want and let Quanty or Arth AI write it for you to check. Both are data languages, not programs: a script reads the bars on the chart and nothing else, it cannot reach the network or your account, and it can place no order. What it gives you is a line on a chart and a condition you can use, in an alert, a rule, a backtest or an algo.
What Arth Script does
| Part | What it does |
|---|---|
| Say it | Describe an indicator or a rule in words, typed or spoken, in 25 languages; Quanty or Arth AI writes it |
| Formulas | 1 to 3 lines per indicator, each one formula on prices, averages, RSI, ATR, highs and lows and plain maths |
| Scripts | Inputs, named values, up to 8 plots, 3 panes and 8 alert conditions in one script |
| Review | Every formula is shown to you, in code and in plain words, before it is saved |
| Server check | Each formula is checked with the chart's own code before saving, so a saved indicator always draws |
| My indicators | Up to 50 saved with your account, on QuantPower and Arth.live |
| Use | On the chart, in alerts, in signal algo rules, in backtests and Forward tests |
| Safety | No network, no files, no page access, no orders |
| Price | Free to write and use; asking Quanty to build one costs 5 tokens |
A short history of indicator languages
Traders wrote their own indicators long before charting software did it for them. Through the 1970s and 1980s, the best-known indicators were published as formulas and worked out by hand or on calculators: J. Welles Wilder set out the relative strength index and the average true range in his book of 1978, and Gerald Appel's MACD came from the same years.1 Any trader who wanted a variation had to do the arithmetic again.
Personal computers brought formula languages. Charting programs of the 1980s and 1990s let traders type an indicator as a formula and see it drawn, and in the early 1990s TradeStation's EasyLanguage became the best known of these, written so that a rule read almost like English.2 AmiBroker's AFL and MetaTrader's MQL followed for desktop traders, each with its own syntax.2
The web brought scripting into the browser. TradingView introduced Pine Script in 2013, and its public library of community scripts made custom indicators part of everyday charting.3 Each language still asked the same thing of the trader: learn the syntax, or find someone who knows it.
The newest step removes that requirement. Large language models can turn a sentence into a formula, which puts custom indicators in reach of traders who have never written code. That makes one thing more important than before: the result must be short enough to read and check, and safe enough that a mistake draws a wrong line rather than doing harm. Arth Script was built for that: a small language, every formula shown before it is saved, and no way for a script to do anything but read the bars.
The two forms of Arth Script
Formulas: My indicators
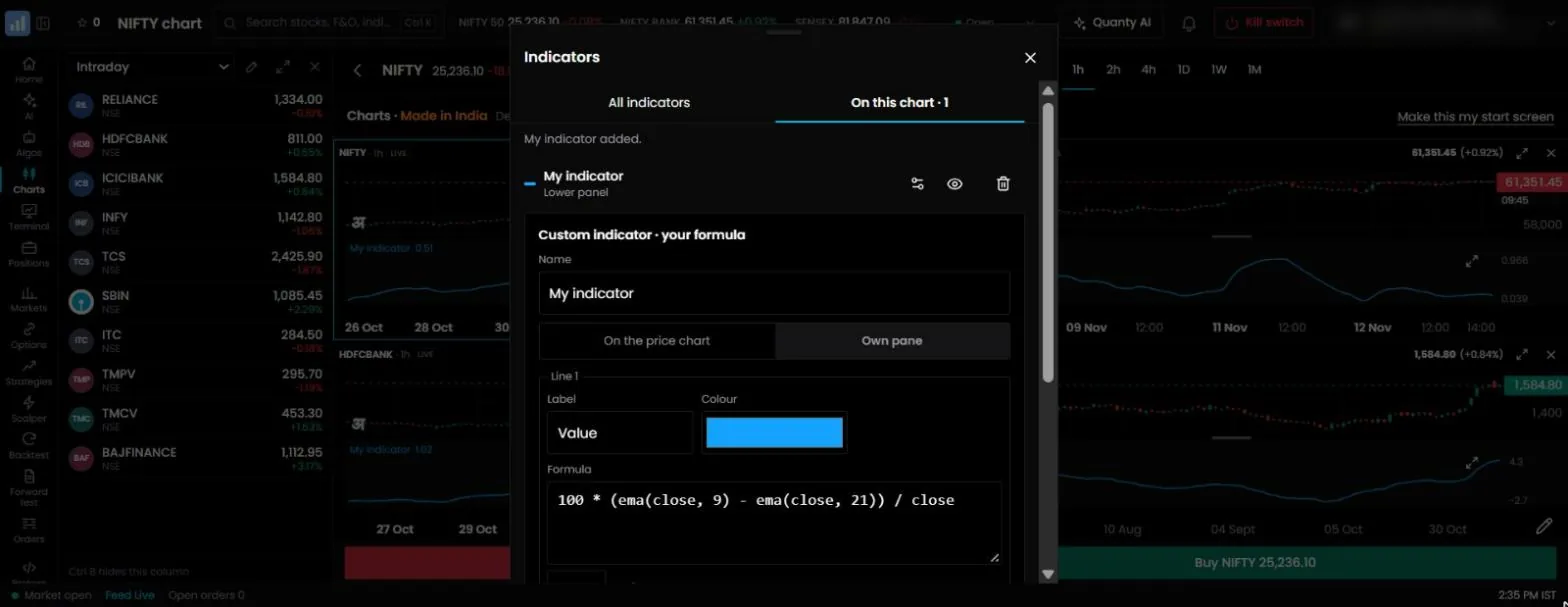
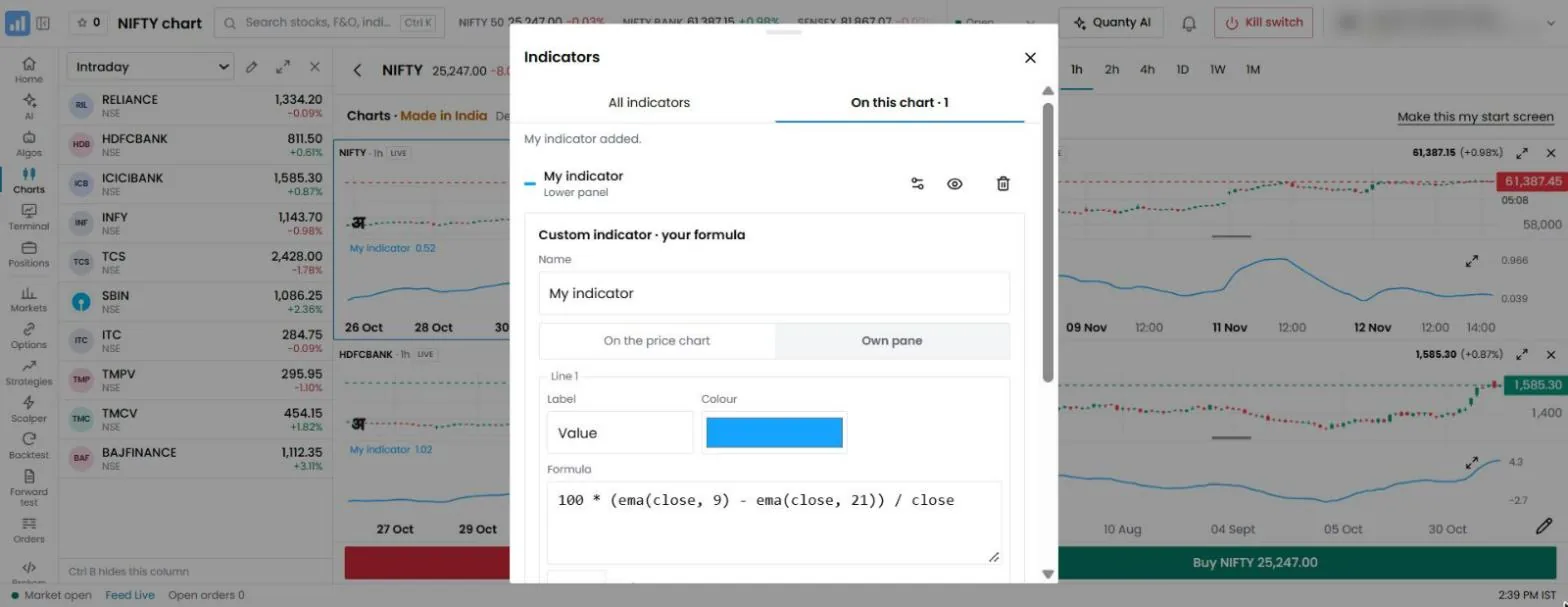
A formula is one line, such as 100 * (ema(close, 9) - ema(close, 21)) / close. An indicator holds one to three formulas, each with a name and a colour, drawn on the price chart or in a pane of its own. You keep your indicators in My indicators, up to 50, and they go with your account to the QuantPower app and to Arth.live.
What a formula can use:
| Kind | Items |
|---|---|
| Prices | open, high, low, close, volume, hl2, hlc3, ohlc4 |
| Maths | + - * /, brackets, abs, sqrt, log, min, max, pow |
| Averages | sma, ema, wma, rma of any series and length |
| Indicators | rsi, stdev, atr, roc, change, highest, lowest |
| Past bars | x[n], the value n bars ago |
| Comparisons | > < >= <= == !=, giving 1 when true and 0 when false |
| Logic | and, or, not |
| Gaps | nz(x, value), a value to use where x is blank |
The functions call the same code as the chart's built-in indicators, so sma(close, 20) in a formula is exactly the chart's Simple MA 20, and rsi(close, 14) is the chart's RSI 14. A bar without enough history yet is left blank, never drawn as zero, and a division by zero is blank too.
A formula has limits that keep the chart fast: up to 500 characters, lengths up to 500 bars, and brackets nested up to 10 deep.
Scripts
A script is a few short lines that can hold inputs you change from the chart, named values, several plots, its own panes and alert conditions:
// Arth Script: two averages and an alert when they cross
length = input(9, "Fast period");
fast = ema(close, length);
slow = sma(close, 21);
plot(fast, "Fast EMA", "#16a3ff");
plot(slow, "Slow SMA", "#f59e0b");
alert(crossover(fast, slow), "Fast crossed above slow");
A script can use input, the averages sma, ema and rma, rsi, lag, abs, min, max, nz, crossover and crossunder, and three outputs: plot on the price chart, panel in a pane of its own, and alert for a condition. One script holds up to 64 statements, 8 plots, 3 panes and 8 alert conditions, up to 8,000 characters, and runs over up to 20,000 bars with a fixed work budget, so no script can freeze the chart.
How it works, step by step
- Say it. Type or speak what you want to Quanty in the QuantPower app, or to Arth AI on Arth.live: "show the gap between the 9 and 21 EMA as a percentage of price, in its own pane".
- The AI writes the formula. It answers with the formula, its name, where it will draw, and the rule in plain words.
- You check it. Read the formula and the plain-words line. If it is not what you meant, say what to change: "use 20 and 50 instead".
- It is checked and saved. When you agree, the server checks the formula with the chart's own code and saves it in My indicators. A formula that would not draw is refused with the reason, so the AI can fix it.
- It draws on your chart straight away, on any symbol and any timeframe.
- Use it in a rule. In a signal algo or an alert, pick your indicator as a condition, such as "my indicator above 0.5". The rule carries the formula inside it.
- Test it. Backtest the rule on past candles and run it in a Forward test, which work the formula out with the same code as the chart.
You can skip the AI and write a formula yourself at any step. The language is small enough to learn in an evening.
Worked examples
Each example below shows what you might say, the formula that results, and what it draws. All are rules you choose; none is a recommendation.
1. The gap between two averages, as a percentage
You say: "Show how far the 9 EMA is above or below the 21 EMA, as a percentage of price, in its own pane."
100 * (ema(close, 9) - ema(close, 21)) / closeIt draws one line around zero. Above zero, the fast average is above the slow one; the further from zero, the wider the gap. Dividing by the price makes the line comparable between a ₹100 share and a ₹3,000 one.
2. Volume against its average
You say: "Show today's volume as a multiple of its 20-bar average."
volume / sma(volume, 20)A value of 2 means the bar traded twice its usual volume. Used in a rule, "my volume ratio above 2" is a simple way to ask for a breakout on heavy trade.
3. ATR bands around an average
You say: "Draw a 20 EMA with bands two ATRs above and below, on the price chart."
ema(close, 20)
ema(close, 20) + 2 * atr(14)
ema(close, 20) - 2 * atr(14)
Three formulas in one indicator, drawn as three lines on the price chart. The bands widen when the market is volatile and narrow when it is quiet, which is the idea behind Keltner channels.
4. An inside bar flag
You say: "Mark bars whose high and low are both inside the previous bar's."
(high < high[1]) and (low > low[1])It draws 1 on an inside bar and 0 otherwise. In a rule, "my inside bar flag equals 1" lets a signal algo watch for the pattern on any symbol.
5. Bollinger %B
You say: "Show where the close sits within the 20-period Bollinger Bands, 0 at the lower band and 1 at the upper."
(close - (sma(close, 20) - 2 * stdev(close, 20))) / (4 * stdev(close, 20))Values above 1 mean the close is above the upper band; below 0, below the lower band.
6. RSI of a smoothed price
You say: "RSI 14, but of a 5-period EMA of the close instead of the close."
rsi(ema(close, 5), 14)Smoothing the price first gives a calmer RSI with fewer crossings of 30 and 70. Nested functions add their lookbacks together, so this line starts a few bars later than a plain RSI.
7. Distance from the 20-day high
You say: "How far is the close below its highest close of the last 20 bars, in per cent?"
100 * (close - highest(close, 20)) / highest(close, 20)Zero means the close is at a 20-bar high; −5 means it is 5% below it.
8. A script with an input and an alert
You say: "Plot RSI 14 in its own pane, let me change the length, and alert when it crosses back above 30."
len = input(14, "RSI length");
r = rsi(close, len);
panel(r, "RSI", "#16a3ff");
alert(crossover(r, 30), "RSI crossed above 30");
The length shows as a setting you can change on the chart, and the alert condition can be used like any other alert.
Familiar indicators written as formulas
Many indicators you know can be written in one line. Writing them yourself is a good way to learn the language, and a starting point for your own variations.
| Indicator | Formula |
|---|---|
| MACD line | ema(close, 12) - ema(close, 26) |
| MACD signal line | ema(ema(close, 12) - ema(close, 26), 9) |
| Stochastic %K (14) | 100 * (close - lowest(low, 14)) / (highest(high, 14) - lowest(low, 14)) |
| Williams %R (14) | -100 * (highest(high, 14) - close) / (highest(high, 14) - lowest(low, 14)) |
| Donchian middle line (20) | (highest(high, 20) + lowest(low, 20)) / 2 |
| ATR as a percentage of price | 100 * atr(14) / close |
| Momentum over 10 bars | close - close[10] |
| Rate of change over 10 bars | roc(close, 10) |
| Typical price above its 20 average | hlc3 > sma(hlc3, 20) |
| Candle body size | abs(close - open) |
| Upper wick | high - max(open, close) |
| Close in the top quarter of the bar | (close - low) / (high - low) > 0.75 |
The chart already has 201 built-in indicators, including all of these and newer families such as pivots (CPR, Camarilla, Fibonacci, Woodie and DeMark), the opening range breakout (ORB), volume profile, market breadth (advance/decline) and order flow (volume delta and cumulative volume delta), so you do not need a formula for the standard version. The full list is on the technical indicators page. Formulas earn their place when you want a variation the built-in list does not offer: a different source, a ratio of two indicators, a flag that combines two conditions.
Messages the checker gives
When a formula cannot be read, the server says why in plain English and where in the line, so you or the AI can fix it. The most common ones:
| You wrote | The message says |
|---|---|
close > open && volume > 1000 | Use and instead of && |
close = open | Use == to compare; a single = is not allowed |
close % 2 | % is not supported; divide and multiply by 100 instead |
close ^ 2 | Use pow(a, b) for powers |
close > open ? 1 : 0 | If and else are not supported; use comparisons, which give 1 or 0 |
rsi(close) | rsi takes two inputs, for example rsi(close, 14) |
ema(close, 9 | A bracket is missing |
A formula that reads correctly but would need more than 500 bars of history, or nests deeper than 10 levels, is refused with its own message. Nothing half-checked is ever saved.
Arth Script on Arth.live and in QuantPower
The language and the chart are the same in both places; what differs is what is around them.
| Arth.live | QuantPower app | |
|---|---|---|
| Charts | Free for everyone, with or without a broker | The same charts inside the trading app |
| The AI | Arth AI: research only, writes and explains indicators | Quanty: writes indicators and builds strategies |
| My indicators | Saved with your account | The same list, shared |
| Alerts | Price and indicator alerts | Price, open interest and indicator alerts |
| Rules and orders | None: Arth.live reads and explains, it places no orders | Signal algos, backtests, Forward tests and algos |
So a trader can write and refine an indicator on Arth.live at no cost, then use the same indicator in a rule in the QuantPower app when he wants to test or automate it.
A worked example: from a sentence to a running rule
Suppose you trade breakouts on Nifty futures and want a rule that enters only on heavy volume.
- Say the indicator. "Show volume as a multiple of its 20-bar average, in its own pane." Quanty writes
volume / sma(volume, 20), explains it, and you save it as "Volume ratio". - Look at it. On a 15-minute Nifty futures chart, the line sits near 1 most of the day and jumps above 2 on the bars where the market breaks out of a range.
- Write the rule. In a signal algo, combine two conditions on closed 15-minute candles: the close crosses above the highest high of the last 20 bars, and Volume ratio is above 2.
- Backtest it. Run the rule on the past candles of Nifty futures, after charges, with a stop and a target in per cent. Read the trade list, the worst stretch and the unseen-days result, not only the total.
- Forward test it. Run the same rule on live prices with test money for a few weeks, and compare its trades with the backtest for the same days.
- Decide. If it behaves as tested, set the signal algo to start your futures algo, or to place the order itself after you arm it.
At no step did you write code. At every step you could read exactly what the rule was.
Who uses Arth Script
- Traders who know their indicator but not a programming language. The sentence is the specification.
- Traders moving from another platform who have a favourite indicator in another language and want it on Arth charts; describe it, or paste it for the AI to explain and rewrite.
- Option traders who want a flag on the index chart, such as a narrow-range day or a volume surge, to decide when a strategy should run.
- Learners who want to see how an indicator is built. Asking the AI to explain each part of a formula, in their own language, is a quick way to understand what an RSI or an ATR measures.
Where you can use your indicators
| Where | How |
|---|---|
| Charts by Arth | Add from My indicators to any chart, on QuantPower or Arth.live |
| Alerts | An indicator alert on your line crossing a level or another line, checked on each closed candle |
| Signal algos | A condition on your indicator, alone or with up to 19 others, that notifies you, places an order or starts an algo |
| Backtests | A rule using your indicator, tested on past candles, after charges |
| Forward test | The same rule on live prices with test money |
| Algos | Started by a signal algo whose condition uses your indicator |
A rule carries its formulas inside it, so the rule worker, the backtesting engine and the Forward test all work out your indicator with the same code as the chart. What you see drawn is what the rule tests.
Say it: what Quanty and Arth AI do
Quanty in the QuantPower app and Arth AI on Arth.live share one engine. Asked for an indicator, they:
- write the formula and the plain-words version of it;
- explain any built-in indicator or any formula you paste, line by line;
- fix a formula the server refused, using the reason it gave;
- answer in the language you wrote in, from English and Hinglish to Hindi, Bengali, Tamil and 20 more.
They do not choose the numbers for you or tell you which setting works best. They are software, not advisers: they turn your rule into a formula and help you understand it, and the trading decision stays yours. Every answer is marked as AI.
In the QuantPower app, Quanty can also build a whole strategy from your words in the strategy builder and save it switched off, for you to check and test.
Arth Script and Pine Script
| Pine Script | Arth Script | |
|---|---|---|
| How you write it | Code in Pine's own syntax | A sentence, or a short formula |
| Who writes it | You, or someone you hire | You, or Quanty and Arth AI from your words |
| What you check | The code | The formula and a plain-words version |
| Community library | Large public library | Your own indicators |
| Using it to trade | Alerts sent by webhook to an algo platform | Conditions in alerts, signal algos, backtests and algos in the same app |
| Languages for the AI | English | 25 languages |
Pine Script work stays useful as a record of your rules. Rewrite a rule in Arth Script, or describe it in words and let Quanty write it, and Arth.live price alerts on that indicator link straight to signal trading.
Why a small language is safer
Most scripting languages for charts can do far more than draw. Arth Script is deliberately small, and the limits are the point.
- It reads only the bars. A formula or a script sees the open, high, low, close and volume of the chart's candles and nothing else: not the network, not your files, not the page, not your account.
- It runs no program code. The formula is read into a tree of known parts, prices, functions and operators, and worked out step by step. Nothing in it is ever run as JavaScript, and words such as
fetch,windoworevalare refused outright. - It cannot loop forever. There are no loops, and a script has a fixed budget of work; one that would use more is stopped with a plain message, so a mistake cannot freeze your chart.
- It cannot trade. No function in either form places, changes or cancels an order. Trading happens only through a rule you set up and switch on, with every risk check of your account.
- It is checked twice. The chart checks a formula as you type it, and the server checks it again with the chart's own code before saving, so what is saved always draws.
- It is shown before it is saved. When the AI writes a formula, you see it, and a plain-words version of it, before anything is saved.
A wrong formula can draw a wrong line. That is the worst it can do, and the review step and a quick look at the chart are there to catch it.
Custom indicators in alerts
An alert on your own indicator works like any indicator alert. Choose the indicator from My indicators, a condition (above, below, crossing up or crossing down) and a level or another line, and a timeframe from 1 minute to 1 week. It is checked once on every closed candle of that timeframe, even with your chart closed, and tells you on your phone and in the app when it is met. For example, an alert on "Volume ratio crossing above 3" on 5-minute Bank Nifty futures tells you when trading suddenly picks up, without a chart open all day. Like every alert, it only tells you; it places no order.
How to write good formulas
- One idea per indicator. A line that measures one thing is easier to read and to test than one that mixes three.
- Normalise when comparing symbols. Divide by the price or an average, as in examples 1 and 7, so the same rule works on a cheap share and an expensive one.
- Mind the warm-up. Long lengths and nested functions need more history before the first value. A 200-bar average on 15-minute candles starts a week into the chart.
- Check by eye. Put the indicator on a chart you know and confirm it rises and falls where you expect.
- Test before trading. A line that looks good on a chart is not yet a rule. Backtest the rule and run it in a Forward test.
Common mistakes
- Using `=` to compare. Use
==. A single=names a value in a script and is refused in a formula. - Expecting `if`. There is no if-else; a comparison already gives 1 or 0, which you can multiply by another value.
- Reading a blank as zero. A blank bar means not enough history yet, not a value of zero.
- Comparing raw prices across symbols. A rule "my line above 50" means one thing on a ₹100 share and another on a ₹3,000 one.
- Fitting the past. Adjusting a formula until a backtest looks perfect usually fits noise. Keep formulas short.
Where custom indicators are going
The barrier that kept custom indicators to a few traders was the language. That barrier is falling: a trader can now say the rule in his own words and read back a formula in a few seconds. The next questions are about trust. A formula written by an AI has to be shown in full, checked by the trader and tested before it trades, and it must be unable to do anything except draw a line. Small, readable, safe languages suit that better than large ones.
Pricing
Arth Script is free: writing, saving and using your indicators costs no tokens, and Arth.live charts are free for everyone. In the QuantPower app, Quanty's first 5 text questions each day are free, a text question then costs 1 token and a build request, such as writing an indicator, 5 tokens (1 token = ₹1, GST extra). Backtests cost 2 tokens after 10 free a week. See pricing.
Start with 500 free tokens
Connect your broker, build a strategy and test it on paper before a single live order goes out.
Frequently asked questions
Do I need to know how to code to use Arth Script?
No. Describe the indicator in words and Quanty or Arth AI writes the formula and shows it back to you in plain words. If you want to write it yourself, the language has a few dozen words and no programs.
How many custom indicators can I save?
Up to 50 in My indicators, each with one to three lines. They go with your account to the QuantPower app and to Arth.live.
Can an Arth Script place orders?
No. A formula or a script only reads the bars and draws. Orders come from a signal algo or an algo that you set up and switch on, with every risk check of your account.
Is my custom indicator the same in a backtest as on the chart?
Yes. A rule carries the formula inside it, and the backtest, the Forward test and the rule worker work it out with the same code as the chart.
Why does my indicator start a few bars late?
Each function needs enough past bars before its first value, and nested functions add their lookbacks together. Until then the bar is left blank rather than drawn as zero.
Can Arth AI explain an indicator I found elsewhere?
Yes. Paste the formula or describe the indicator, and it explains what each part measures, in your language. It does not tell you whether to trade it.
Related guides
- Technical indicators: what the common indicators measure
- Quanty AI: the assistant that writes your formulas
- TradingView algo trading: what TradingView alerts can and cannot do, and the Arth.live route
References
- J. Welles Wilder Jr., *New Concepts in Technical Trading Systems* (1978), on RSI and ATR; Gerald Appel, *The Moving Average Convergence-Divergence Trading Method* (1979)
- TradeStation, EasyLanguage documentation (tradestation.com); AmiBroker, AFL reference (amibroker.com); MetaQuotes, MQL documentation (mql5.com)
- TradingView, Pine Script documentation and release notes (tradingview.com)
- QuantPower: Arth Script formula and script languages, limits and saved indicators, from the app's code, checked 12 November 2026