A backtest answers one question: if these exact rules had run on those past days, what would have happened? It is a test of the rules, not a forecast. QuantPower runs two kinds. A rule backtest tests a condition on one instrument, such as a moving-average cross on Nifty futures, on your broker's own candles. An option strategy backtest tests a set of option legs, such as a short straddle with a stop on each leg, minute by minute through each trading day. Both deduct brokerage and statutory charges from every trade, both show every trade, and both hold back part of the period to check the rules on days they were not built on.
What QuantPower's backtesting does
| Part | What it does |
|---|---|
| Rule backtest | Tests a rule on one instrument over up to 2,000 past candles, from 5-minute to daily |
| Option strategy backtest | Tests a set of option legs day by day, minute by minute, from entry time to exit time |
| Data | Candles from your connected broker, read when the backtest runs |
| Rules | The same entries, exits, stops and targets you set in the app |
| Costs | Brokerage per order, STT, exchange charges, SEBI fees, stamp duty and GST, deducted from each trade |
| Slippage | A setting you choose, applied to every fill |
| Results | Every trade, the equity curve, drawdown, win rate, results by month and by weekday, and the reason each trade closed |
| Unseen-days check | The last 30% of the period is held back and compared with the first 70% |
| Price | 2 tokens a run; the first 10 runs each week are free |
A short history of backtesting
Traders tested rules on past prices long before computers did it for them. In the 1950s and 1960s, Richard Donchian, often called the father of trend following, worked out rules for commodity futures by hand from price charts and published weekly trading signals built on them. The method was the same as today's: write the rule down, apply it to the past without changing it along the way, and count the result.1
Computers turned the hand count into a routine. By the 1970s and 1980s, commodity trading advisers in the United States were running their trend rules on years of daily prices, and the first trading-system software for personal computers let individual traders do the same. The well-known "Turtle" experiment of 1983, in which a group of new traders were taught a written breakout system and traded it with real money, made the case that a tested, written rule could be followed by anyone.1
Testing also exposed its own traps. A rule tuned again and again until it fits the past will look excellent on that past and fail on the next year's prices. In 1992 Robert Pardo described walk-forward analysis: build the rules on one stretch of data, test them on the stretch that follows, and repeat.2 Researchers have since written at length about look-ahead bias, where a test uses information that was not known at the time, and about how testing many versions of a rule finds patterns in noise.3
In India, the history that matters for a backtest is short and full of changes. Index futures on the NSE began in June 2000 and index options in June 2001. Weekly index options came much later, and for years each exchange listed weekly expiries on several indices. On 1 October 2024 SEBI cut that to one weekly expiry per exchange, raised the minimum contract size and changed several other rules for index derivatives, mostly from 20 November 2024.4 From 1 September 2025 the NSE moved its weekly and monthly expiries to Tuesday.5 From 1 April 2026 the securities transaction tax on futures and options went up.6 A backtest that spans these dates is testing a strategy across several different markets, which is why the period you choose matters as much as the rules.
Two kinds of backtest
Rule backtests
A rule backtest takes one instrument, such as Nifty futures, a stock or an index, and a rule written in the app: a price condition, an indicator crossing a level or another indicator, or a custom indicator you made with Arth Script. It reads the past candles of that instrument from your connected broker, from 5-minute to daily, up to 2,000 candles in one run.
The test holds one position at a time. You set a stop-loss and a target in per cent, an exit rule, and the slippage. When the entry condition is met on a closed candle, the test opens a position at that candle's price, adjusted for slippage. It then checks the stop, the target and the exit rule on every candle that follows until one of them closes the trade, and repeats for the next entry.
If your broker has no candles for that instrument and period, the backtest says "Data is not available" and stops. Nothing is filled in or made up.
Option strategy backtests
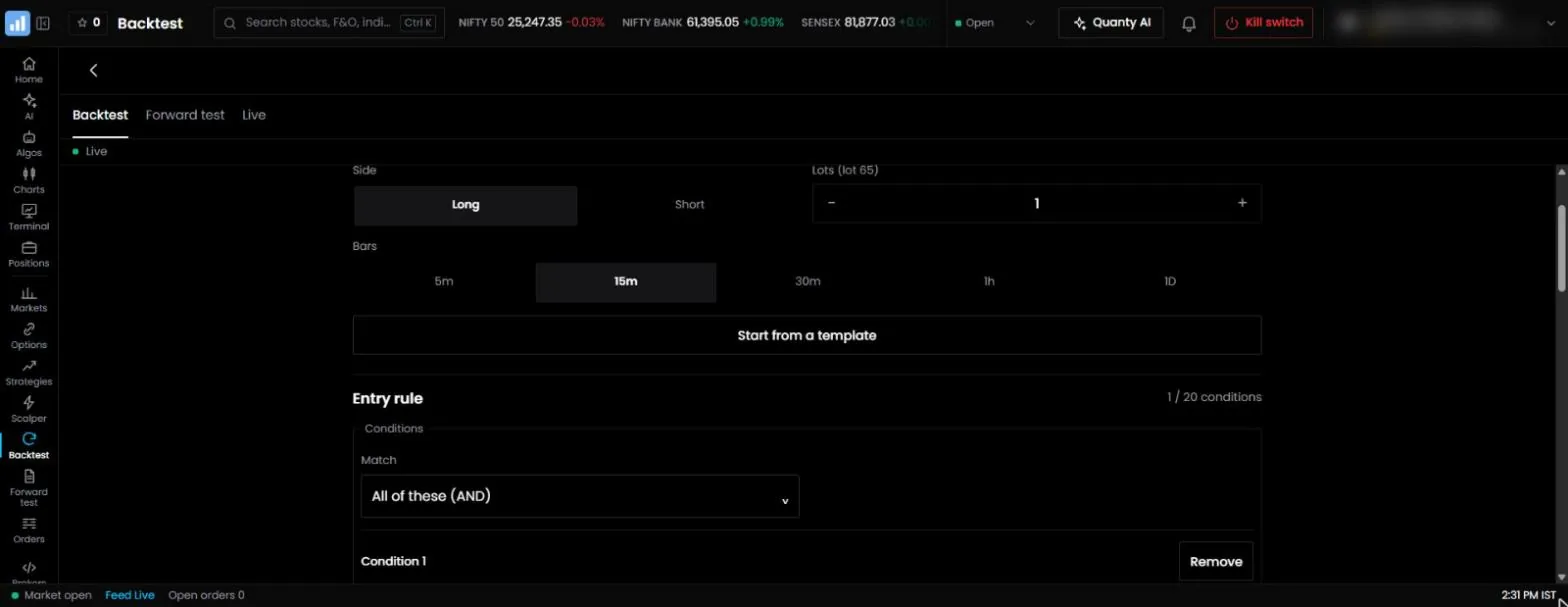
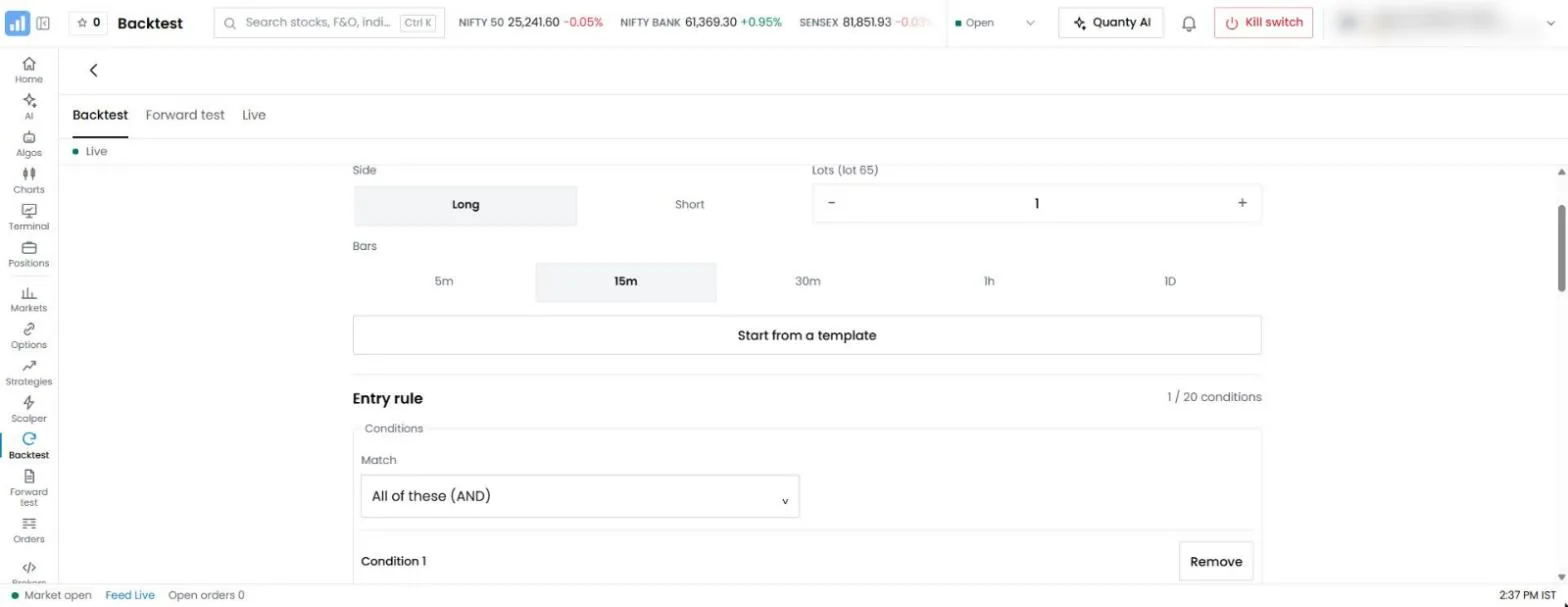
An option strategy backtest tests a set of legs: which options to buy or sell, how many lots, when to enter and when to exit. It is built for the strategies most option traders in India run, such as straddles, strangles, iron condors and spreads on Nifty, Bank Nifty and Sensex.
For each trading day in the period:
- At the entry time, each leg picks its strike from the index price at that minute: at the money, or a set number of strikes in or out of the money.
- Each leg is filled at its option price, adjusted for slippage.
- Every minute after that, each open leg is checked against its own stop-loss and target, measured from the leg's entry price.
- Every minute, the whole strategy is also checked against an overall stop-loss and target in rupees.
- At the exit time, whatever is still open is closed.
- Charges are worked out for each leg and deducted.
The day's result is then added to the record, and the test moves to the next trading day. Days the strategy is not set to trade are skipped, so a strategy set for expiry days only is tested on expiry days only.
How a backtest runs, step by step
- Write the strategy. For an option strategy, build the legs in the strategy builder or load a template, such as a short straddle or an iron condor, and change it to your own rules. For a rule, set the condition, the instrument and the candle size.
- Choose the period. Pick dates that cover the market you want to test: quiet months and sharp moves, rising and falling markets, and the expiry-day rules that apply to your strategy.
- Set the costs. Brokerage per order and slippage. Statutory charges are added by the engine.
- Run it. A run is charged only when it gives a result. If it fails, it costs nothing.
- Read the result. Start with the trade list and the worst period, not the total.
- Change one thing and run again. If you change only the slippage, the run is free. Any other change is a new backtest.
What the results show
| Measure | What it tells you |
|---|---|
| Days tested, winning days and losing days | How much of the period the strategy actually traded |
| Win rate | The share of days or trades that made money |
| Net P&L, gross P&L and charges | Whether the rules made money after costs, and how much the costs took |
| Average winning day and average losing day | How the result is made: many small wins or a few large ones |
| Best day and worst day | The range of single-day outcomes, with their dates |
| Maximum drawdown, with its start and end dates | The largest fall from a peak, and the loss you must be ready to sit through |
| Longest losing streak | How many losing days in a row the rules produced |
| Results by month | Whether the result is steady or comes from a few months |
| Results by weekday | Whether the result depends on one day of the week, such as expiry day |
| Exit reasons | How many trades closed on a stop, a target, the overall limit or the exit time |
| Equity curve | The running total, day by day |
| Return and drawdown in per cent | Shown when you enter the capital you would trade with |
Notes the report adds
Every result comes with plain warnings, written by the engine from the numbers themselves:
- If the test covers fewer than 60 days, the report says the period is short and can make a strategy look better or worse than it is.
- If the win rate is 70% or more but the average losing day is two and a half times the average winning day or more, the report says that one bad day can take back many good ones.
- If the worst single day lost more than half of the total profit, the report says so.
- If the unseen days are weaker than the days the strategy was built on, the report says so.
- If charges take more than 40% of the gross profit, the report says so.
- Every report ends with the reminder that past results do not show what will happen next.
These notes are there because the headline numbers of a backtest are easy to misread. A strategy that wins on four days out of five sounds safe; a note that its losing days are three times its winning days tells a different story.
The unseen-days check
The most common way a backtest misleads is overfitting: the rules are adjusted until they fit the past period well, and the fit does not carry over to new days. QuantPower's option strategy backtest builds a simple guard against this into every run.
The test splits the period in two. The first 70% of the trading days are treated as the days the strategy was built on. The last 30% are treated as unseen. The report then compares the average result per day in each part and gives one of five verdicts:
| Verdict | What it means |
|---|---|
| Held up on unseen days | The unseen days averaged at least half of what the built-on days averaged |
| Weaker on unseen days | The unseen days were profitable but averaged less than half |
| Fell apart on unseen days | The unseen days lost money on average |
| Lost money even in the period it was built on | The rules did not work even on the days they were fitted to |
| Too few days to judge | Fewer than 20 built-on days or fewer than 10 unseen days |
The check is not a full walk-forward testing routine, which repeats the build-and-test step across many windows. It is a quick first filter. If a strategy fails it, there is little point in a longer test.
What the candle size means for your results
A candle records the open, high, low and close of its period. The size you test on decides what the backtest can and cannot see.
- Entries and exits at a time. A rule such as "enter at 9:20 am" or "exit at 3:10 pm" is tested at the price of that minute in an option strategy backtest, and at the candle that contains that time in a rule backtest.
- Stops and targets inside one candle. If a stop and a target both fall inside the same candle, the candle cannot show which came first. Read such trades conservatively and assume the stop was hit first. Smaller candles reduce how often this happens.
- Fast strategies. Strategies that trade within seconds, or need the exact order of trades, cannot be tested precisely on minute or longer candles. Scalping rules with targets of a few rupees fall into this group.
- Fills. A backtest fills at candle prices adjusted for slippage. Live orders also meet the bid-ask spread and, in thin strikes, a price that moves against a large order. Set the slippage with that in mind.
For most option buying, option selling and spread strategies held for fifteen minutes or more, minute prices capture the moves that decide the result. For positional strategies held for days, daily candles are enough.
Costs in the backtest
Charges are deducted from every trade, leg by leg:
- Brokerage, at the rate per order you set. The default is ₹20 an order, the common rate at discount brokers.
- Securities transaction tax (STT), at the rates in force from 1 April 2026.6
- Exchange transaction charges, SEBI fees and stamp duty, at the current rates.
- GST on brokerage and exchange charges.
Costs matter more for options than for most other trading. A four-leg iron condor entered and exited once a day places eight orders, so at ₹20 an order it pays ₹160 in brokerage alone before any tax. Over a year of daily trading that is more than ₹38,000 in brokerage for one lot. A strategy that makes a few rupees a trade before costs rarely survives them, which is why the report shows net, gross and charges side by side, and warns when charges take a large share of the gross. The brokerage calculator on this site shows the charges on a single trade.
Slippage is the other cost. It is the gap between the price the test assumes and the price a live order would get. QuantPower applies the slippage you set to every fill: a buy is filled a little higher and a sell a little lower. You can run the same test again with a different slippage at no charge, which is the quickest way to see how sensitive a strategy is to it.
Indian market changes a backtest must respect
A backtest of an Indian options strategy runs into rule changes that a test of a stock or a foreign index might not. These are the ones to keep in mind when you choose the period:
| Change | When | What it means for a backtest |
|---|---|---|
| One weekly expiry per exchange | From 20 November 2024 | Weekly strategies on indices that lost their weekly expiry cannot be tested on dates after it |
| Larger index contract size and new lot sizes | From 20 November 2024, with later revisions | Rupee results per lot differ before and after; compare in per cent or per unit of capital |
| NSE expiry day moved to Tuesday | From 1 September 2025 | An "expiry-day" rule falls on Thursday before this date and Tuesday after it |
| Higher STT on futures and options | From 1 April 2026 | Older trades cost less tax than the same trades would today |
| Retail algo framework in force | From 1 April 2026 | Live algos run through a broker under the exchange's rules; the backtest itself is not affected |
None of this means older data is useless. It means a result from 2023 is evidence about a slightly different market. The more of your result comes from before these changes, the more weight to put on the recent part of the test.
A worked example: testing a short straddle
Take a Nifty weekly short straddle: sell the at-the-money call and put at 9:20 am on expiry day, with a stop-loss of 30% on each leg and an exit at 3:10 pm.
- Build the two legs with the strike "at the money", one lot each, entry at 9:20 am and exit at 3:10 pm.
- Set a stop-loss of 30% on each leg, measured from its entry price, and no target.
- Set the days to expiry day only.
- Choose a period of at least a year, so the test covers both Thursday and Tuesday expiries.
- Set brokerage at your broker's rate and slippage at a level you would expect for at-the-money Nifty options.
- Run the test and open the trade list.
Then read it in this order:
- The exit reasons. How many legs closed on their stop, and how many lasted to 3:10 pm? A straddle where most days end with one leg stopped out is a different strategy from one where both legs usually reach the exit time.
- The worst days. Open the three worst days. Did the stops trigger at the minute you expect? Was the loss larger than two stops would suggest because the index moved sharply after the second leg was stopped?
- The unseen-days verdict. If the last 30% of the period is much weaker than the first 70%, the rules may only fit the earlier market.
- The months. If most of the profit comes from two or three months, the strategy depends on those conditions returning.
- The settings around yours. Run the test with stops of 25% and 35%. If the result changes from a profit to a loss, the 30% figure is fragile.
Only if the result is steady across months, nearby settings and the unseen days is it worth running a forward test on live prices.
A worked example: testing a rule on Nifty futures
Take a trend rule on Nifty futures: buy when the 20-period exponential moving average crosses above the 50-period one on 15-minute candles, with a stop-loss of 0.5%, a target of 1% and an exit when the averages cross back.
- Choose Nifty futures and 15-minute candles.
- Write the entry condition: EMA 20 crosses above EMA 50.
- Set the stop-loss at 0.5%, the target at 1% and the exit rule as the opposite cross.
- Set slippage and brokerage.
- Run the test over the most recent candles available, up to 2,000.
On 15-minute candles, 2,000 candles cover about 80 trading days. That is long enough to see how the rule behaves, and short enough that you should not treat the result as proof. Run the same rule on hourly candles as well; 2,000 hourly candles cover more than a year. If the rule only works on one candle size, it is probably fitting noise.
How to read a backtest well
- Check the trades, not only the total. Open a few trades from good and bad months and confirm they follow the rules as you meant them.
- Look at the worst period first. The maximum drawdown and the longest losing streak matter more than the average. Ask whether you would have kept trading through them.
- Split the period. The unseen-days check does this once. You can do it again by running the same rules on different years.
- Test small changes. If moving a stop from 30% to 35% turns a profit into a loss, the result is fragile.
- Compare with a simple baseline, such as the same entry without the filter you added. A filter that does not beat the plain version is not adding anything.
- Count the costs. Look at net P&L first. If charges take most of the gross, the strategy is working for the broker and the exchange.
- Prefer fewer rules. Every extra condition fits the past a little better and the future a little worse.
The backtest performance metrics guide explains each measure in the report in more depth.
Common backtesting mistakes
- Using information that was not known at the time. A rule that enters "at the day's low" or uses a candle's close before the candle has closed looks perfect on paper and cannot be traded. QuantPower's rule backtest acts only on closed candles for this reason.
- Testing many versions and keeping the best. Run fifty versions of a rule and one will look excellent by chance. Treat the best result of many runs with suspicion, and check it on the unseen days.
- Choosing a convenient period. A short-selling strategy tested only on a falling year will look good. Test across rising, falling and quiet markets.
- Leaving out costs and slippage. The most common reason a backtest profit turns into a live loss.
- Ignoring liquidity. A backtest fills any size at the candle price. A large order in a far out-of-the-money strike may not.
- Ignoring rule changes. Expiry days, lot sizes and taxes have changed several times since 2024. A strategy built on old rules may not exist in the same form today.
Backtesting with Quanty and your own AI app
You do not have to set every field by hand. Quanty, the AI assistant in the QuantPower app, can build a strategy from your description, backtest it and run a risk check that flags missing stops or sold options without a hedge. You check the strategy and the result, and Quanty saves it switched off. It cannot switch an algo on; only you can.
If you use your own AI app, such as Claude or ChatGPT, Connect AI links it to your QuantPower account. With your permission it can backtest your own rules and option strategies and show you the result, using the same engine and the same prices as the app. A backtest that an AI app starts costs the same as one you start yourself, and uses the same free runs.
Neither Quanty nor a connected AI app will tell you which strategy to trade. Both are software, not advisers: they help you write down and test your own rules.
From backtest to live trading
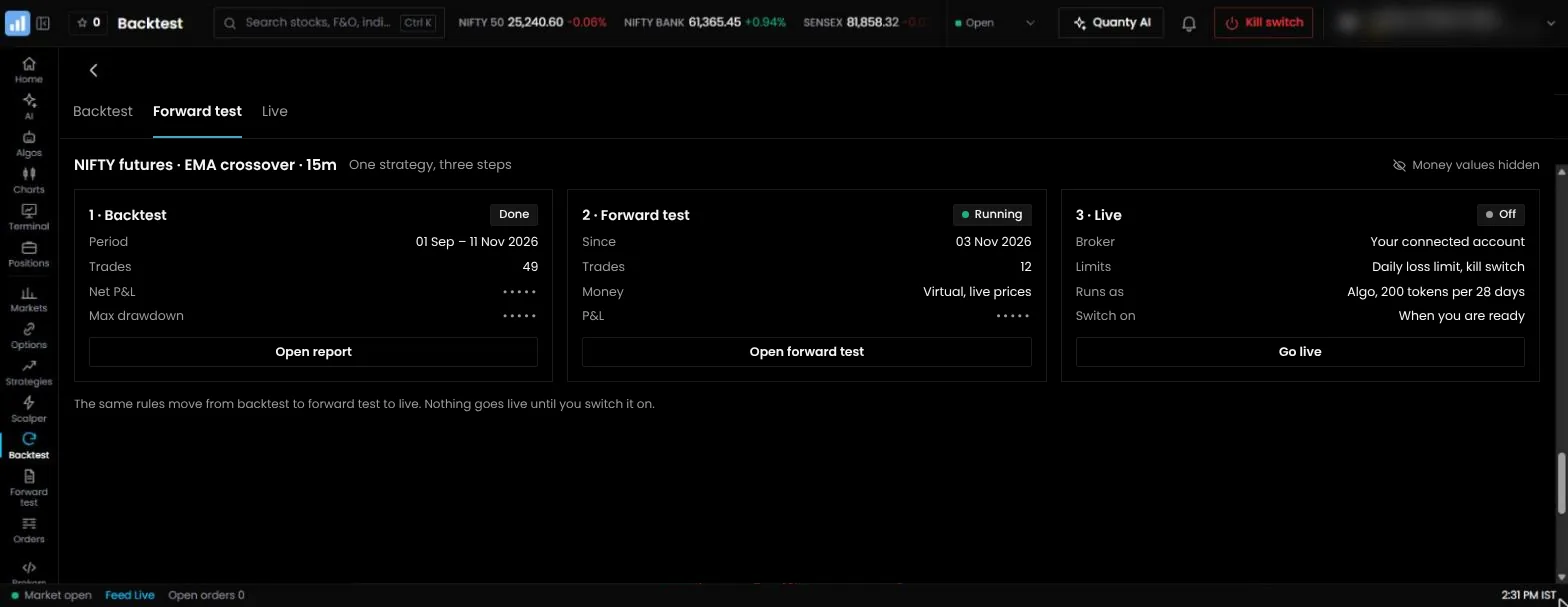
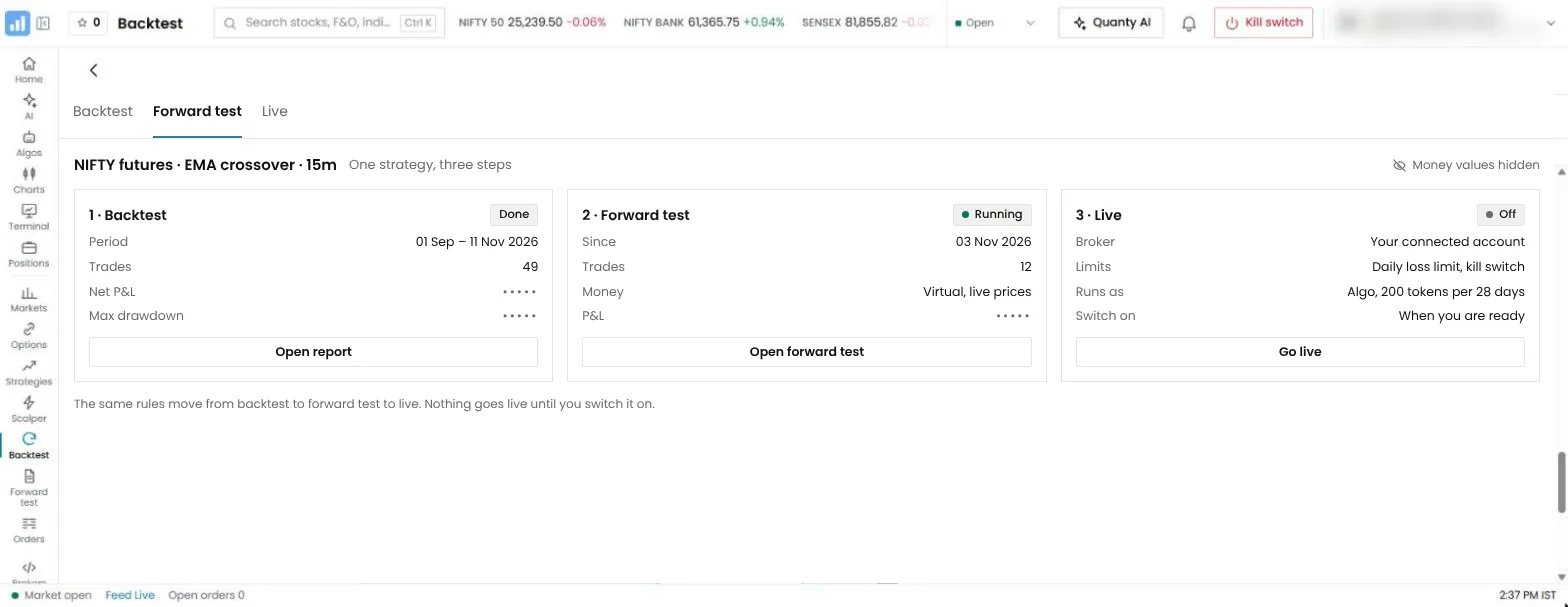
A backtest is the first of three tests:
- Backtest the rules on past data, as on this page.
- Forward test the same strategy on live prices with test money for several weeks. A forward test meets what a backtest cannot: the real spread, the real fills, broker sessions that expire and orders that are refused. Forward test costs 100 tokens per algo per 28 days.
- Run it live on your own broker account with the smallest size, and increase the size only when live results match the forward test.
Compare the three for the same weeks. If the forward test is much weaker than the backtest over the same days, the gap usually comes from fills, spreads or a rule that behaves differently on live prices. Find the cause before you add money.
What a backtest cannot tell you
- The future. The past is one path. Whatever period you choose covers some rallies, falls and quiet spells, but not every kind of market.
- Your own behaviour. A drawdown on a screen is easier to sit through than the same loss in your account. If you would have switched the strategy off in its worst month, the backtest's total is not your total.
- Liquidity and market impact. The test cannot see whether a large order would have moved a thin strike.
- Events. Exchange outages, broker outages, sudden margin changes and trading halts do not appear in candle data.
- Rule changes still to come. Lot sizes, expiry days and taxes have changed often, and may change again.
Where backtesting is going
Three changes are already visible. The first is scale: what took a desktop and a night now takes a browser and a few seconds, so traders test more ideas and need better guards against overfitting, such as the unseen-days check. The second is AI: assistants that write a strategy from a sentence also make it easy to produce many strategies quickly, which makes honest, costed testing more important, not less. The third is regulation: since 1 April 2026, algos offered to retail traders in India run through brokers under exchange rules, with each strategy registered.7 Testing records are becoming part of how a trader explains what an algo does and why it was switched on.
Pricing
Backtests are priced in tokens (1 token = ₹1, GST extra). A backtest costs 2 tokens a run, and the first 10 runs each week, Monday to Sunday, are free. A run that fails is not charged, and running the same test again with only the slippage changed is free. Charts, the option chain, the screener and the strategy builder are always free. New accounts get free sign-up tokens. See pricing for the full list.
Start with 500 free tokens
Connect your broker, build a strategy and test it on paper before a single live order goes out.
Frequently asked questions
What data does QuantPower's backtesting use?
Candles from your connected stock broker, read when the backtest runs. Rule backtests use candles from 5-minute to daily, up to 2,000 candles a run. QuantPower keeps no market history of its own, so a backtest needs a connected broker. If the data is not available, the test says so and does not fill the gap.
Can I backtest option strategies with several legs?
Yes. An option strategy backtest picks each leg's strike at the entry time, fills it at its option price with slippage, and checks each leg's stop and target and the strategy's overall stop and target every minute until the exit time.
Are costs included in the backtest?
Yes. Brokerage at the rate you set, STT, exchange charges, SEBI fees, stamp duty and GST are deducted from every trade, and the report shows net P&L, gross P&L and charges separately.
How many backtests can I run for free?
The first 10 each week, Monday to Sunday. After that a run costs 2 tokens. A failed run costs nothing, and changing only the slippage and running again is free.
Can I backtest a scalping strategy?
Strategies that trade within seconds or aim for a few rupees a trade cannot be tested precisely on minute or longer candles, because the order of prices inside a candle is not known. Strategies held for fifteen minutes or longer can be tested.
Can Quanty run a backtest for me?
Yes. Describe the strategy in words; Quanty builds it, backtests it and shows the result for you to check. It costs the same as a backtest you start yourself.
Related guides
- Backtest trading strategies: the method, step by step
- Backtesting mistakes and look ahead bias
- Avoiding overfitting: why rules tuned to the past fail on new data
References
- Michael W. Covel, *The Complete TurtleTrader* (2007), on Richard Donchian's trend rules and the 1983 Turtle experiment
- Robert Pardo, *Design, Testing and Optimization of Trading Systems* (1992), on walk-forward analysis
- David H. Bailey, Jonathan M. Borwein, Marcos López de Prado and Qiji Jim Zhu, "The Probability of Backtest Overfitting", *Journal of Computational Finance* (2016)
- SEBI, circular "Measures to strengthen Equity Index Derivatives framework for increased investor protection and market stability", 1 October 2024 (sebi.gov.in)
- NSE, circular on the revision of expiry days of derivatives contracts, effective 1 September 2025 (nseindia.com)
- Union Budget 2026-27: securities transaction tax on futures and options raised from 1 April 2026 (indiabudget.gov.in)
- SEBI, circular on safer participation of retail investors in algorithmic trading, 4 February 2025, in force for every broker from 1 April 2026 (sebi.gov.in)
- QuantPower: backtest engine, limits and prices, from the app's code and price list, checked 12 November 2026