For example, with a ₹5,00,000 account and 1% risk per trade, the budget is ₹5,000. A Nifty futures trade with a 60-point stop risks ₹3,900 a lot (60 × 65), so the position size is 1 lot. Two lots would risk ₹7,800, or 1.56% of the account. Position sizing turns a vague sense of "not too much" into a number you decide before the trade, from two things you control: how much of the account you will lose if you are wrong, and where you will admit it. The calculator does the arithmetic; the discipline of using the same rule on every trade is what protects the account through a losing run.
A short history of position sizing
How much to bet is an older question than what to bet on. In 1956 John L. Kelly Jr., a scientist at Bell Labs, published a formula for the share of capital a gambler with an edge should stake to grow his wealth fastest over many bets.1 Edward Thorp used it at the blackjack table, described in his 1962 book *Beat the Dealer*, and later in the markets, where the Kelly criterion became the starting point for thinking about bet size.2
Futures traders worked out their own rules. The "Turtle" traders of the 1980s sized every position by the market's average true range, so that a day's typical move in any market cost the account about the same amount; a quiet bond contract got more units and a wild commodity fewer.3 In 1990 Ralph Vince's *Portfolio Management Formulas* set out fixed fractional sizing, risking a fixed share of the account on each trade, and showed how the choice of that share could matter more than the choice of trades.4 Van K. Tharp's books of the late 1990s made "position sizing" a phrase every systematic trader knew.5
For Indian derivatives traders the question has a local twist: contracts come in lots set by the exchange, and lot sizes have been revised several times, most recently from the January 2026 series, when the Nifty lot became 65 and the Bank Nifty lot 30.6 A sizing rule therefore has to round to whole lots, and a small account often finds that one lot is already more than its rule allows.
How to use the position size calculator
- Choose the instrument: shares, futures or options.
- Enter your account size and the share of it you are willing to lose on one trade.
- Enter the entry price and the stop loss. For options, enter the premium you pay and the premium at which you will exit.
- For futures and options, enter the lot size.
The result shows the risk budget, the position size, the loss if the stop is hit and the value of the position, then the size at 0.5%, 1%, 1.5% and 2% risk.
Position size formula
For shares: a ₹5,00,000 account risking 1% has a budget of ₹5,000. Buying at ₹1,385 with a stop at ₹1,360 risks ₹25 a share, so the position is 5,000 ÷ 25 = 200 shares, worth ₹2,77,000. If the stop is hit, the loss is ₹5,000.
| Shares | Nifty futures | Nifty option bought | |
|---|---|---|---|
| Entry and stop | ₹1,385 and ₹1,360 | 25,050 and 24,990 | ₹120 and ₹90 premium |
| Risk a unit | ₹25 | 60 points | ₹30 |
| Risk a lot | Not applicable | ₹3,900 | ₹1,950 |
| Position size | 200 shares | 1 lot | 2 lots |
| Loss if the stop is hit | ₹5,000 | ₹3,900 | ₹3,900 |
| Position value | ₹2,77,000 | ₹16,28,250 | ₹15,600 of premium |
All three use a ₹5,00,000 account and 1% risk. In the futures and options cases the loss at the stop is below the budget, because the size is rounded down to whole lots.
Position sizing calculator for futures
Futures come in whole lots, so the size jumps in steps. One lot of Nifty futures with a 60-point stop risks ₹3,900. The table, from the position sizing calculator above, shows what that means at different risk levels.
| Risk per trade | Budget | Size | Loss if stopped |
|---|---|---|---|
| 0.5% | ₹2,500 | 0 lots | ₹0 |
| 1% | ₹5,000 | 1 lot | ₹3,900 |
| 1.5% | ₹7,500 | 1 lot | ₹3,900 |
| 2% | ₹10,000 | 2 lots | ₹7,800 |
At 0.5% the budget cannot pay for one lot, so the right size is zero: either widen the budget, tighten the stop or skip the trade. A wider stop needs a larger account for the same lot. The position value, ₹16,28,250 here, is more than three times the account, which is why the stop decides the risk and not the margin.
Position sizing in option trading

Position sizing in option trading has two cases.
- Bought options. Size on the premium. With entry ₹120 and exit ₹90, the risk is ₹30 a unit, or ₹1,950 a lot, so a ₹5,000 budget allows 2 lots. Remember the worst case: if the market gaps past your exit, the option can lose more than planned, up to the full ₹15,600 of premium, or 3.1% of the account. Some traders size bought options on the whole premium for that reason.
- Sold options. The loss on a sold option has no cap, and the premium can rise several times in a fast move. Size by the stop you will use, test it against a gap of a few percent in the index, and check the margin; the F&O margin calculator shows it. Hedged positions such as spreads have a known maximum loss, which makes sizing simpler.
Delta does not replace a stop. An option with a delta of 0.5 moves about half as much as the index at first, but the delta changes as the price moves, so size on the premium you will exit at.
Slippage, charges and gaps

A stop loss order limits the loss only if it fills near its price. In a fast market it can fill several points worse. Add the slippage you expect to the stop distance before sizing. A 60-point Nifty futures stop with 10 points of slippage is a 70-point risk, ₹4,550 a lot, still within a ₹5,000 budget.
Charges add to every loss too. A round trip in one lot of Nifty futures costs about ₹968 in brokerage and taxes, as the brokerage calculator shows, so the full loss at a 60-point stop is about ₹4,868. Overnight positions also face gaps: a stock or index can open beyond your stop, and the stop then fills at the open price.
How much to risk per trade
Most rule-based traders risk between 0.5% and 2% of the account per trade. The table shows what is left after a run of losses, with each trade risking the same share of the account as it then stands.
| Risk per trade | After 10 losses in a row | After 20 losses in a row |
|---|---|---|
| 1% | 90.44% of the account | 81.79% |
| 2% | 81.71% | 66.76% |
| 5% | 59.87% | 35.85% |
Runs of ten losses are common for strategies that win less than half the time. At 1% risk the account survives them comfortably; at 5% it loses 40%. Formulas that set the size from the win rate and the payoff, such as Kelly criterion position sizing, often give larger sizes than this and are usually used at a fraction. Pair the size with the trade's target: the risk reward ratio calculator shows the win rate a plan needs to break even.
Why a losing run decides the size
Every strategy has losing runs, and they are longer than most traders expect. A strategy that wins 40% of its trades will, over a few hundred trades, very likely see eight or ten losses in a row at some point; one that wins 55% will still see six or seven. The size you choose decides what such a run does to the account, and so whether you are still trading the strategy when its winning trades come.
At 1% risk, ten losses in a row leave about 90% of the account. The trader is annoyed but intact, and a few average winners bring him back. At 5% risk, the same run leaves about 60%, and the account then needs a 67% gain to recover. Most traders stop following their rules long before that. Seen this way, position sizing is less about any single trade than about surviving the worst stretch of a strategy that works on average.
A checklist before each trade
- The stop is set from the market, not from the size: below support, beyond an ATR multiple, or at the premium where the idea is wrong.
- The risk per unit includes slippage you expect at that stop.
- The size is rounded down to whole shares or lots.
- The loss at the stop, plus charges, fits the budget.
- A gap test fits the wider limit for overnight positions and sold options.
- The total open risk stays under your cap after adding this trade.
- The margin fits with a buffer for a day's move and a rise in SPAN.
If any line fails, the trade is smaller or does not happen. The calculator covers lines 2 to 4; the rest take a minute of judgement.
Intraday shares and leverage
Intraday share trades are usually allowed with less than the full value in margin, so a ₹5,00,000 account can hold positions worth several times that during the day. That leverage changes nothing in the sizing rule. Size by the stop: a ₹2,000 share with a ₹10 stop and a ₹5,000 budget is 500 shares, worth ₹10,00,000, whether or not the margin would allow 2,000 shares. The margin sets the ceiling on what you can buy. The stop and the budget set what you should.
Commodity and currency contracts
The same formula works for MCX commodity futures and for currency futures; only the contract details change. Each contract has its own lot or multiplier: a price move of ₹1 in a commodity contract is worth a fixed number of rupees per lot, set by the exchange for that contract, and mini contracts exist for several commodities with a smaller multiplier. Enter the rupee value of a one-unit move as the lot size in the calculator, and the stop in the contract's own price units. Commodity markets also trade into the evening and react to overseas markets overnight, so gaps between sessions are common and a gap test matters even for positions that are closed each day. Mini contracts are often the answer when one standard lot already risks more than the budget allows.
After a large win
Fixed fractional sizing raises the rupee budget as the account grows, which is how it compounds. The danger after a large win is different: the temptation to treat the profit as free money and risk more of it. A profit added to the account is part of the account. If the rule is 1%, it is 1% of the new total, no more.
Ways to size a position
The calculator uses fixed fractional sizing: the same share of the account at risk on every trade. It is the most common method among rule-based traders, but not the only one.
| Method | How the size is set | Strength | Weakness |
|---|---|---|---|
| Fixed lots | The same number of lots every trade | Simple | Risk varies with the stop; does not shrink after losses |
| Fixed capital | The same rupee value of position every trade | Simple for shares | Ignores the stop distance |
| Fixed fractional (risk %) | A set share of the account lost at the stop | Risk is the same on every trade; size falls after losses | Needs a defined stop |
| Volatility (ATR) | The stop is a multiple of the average true range; the size follows | Adapts to quiet and wild markets | Wide stops in volatile markets mean small sizes |
| Kelly fraction | A share of the account from the win rate and payoff | Grows the account fastest in theory | Needs reliable estimates; full Kelly swings hard |
The methods can be combined. A common pairing is a volatility-based stop, so the stop sits outside the market's normal noise, with fixed fractional risk, so every trade risks the same share of the account.
Sizing with the average true range
The average true range (ATR) measures how far a market typically moves in a bar. Setting the stop at a multiple of it puts the stop outside ordinary noise.
For shares the same rule sizes positions across different stocks evenly. With a ₹5,000 budget and a stop at 2 ATR, a ₹1,000 stock with an ATR of ₹20 gives 125 shares, worth ₹1,25,000, while a ₹500 stock with an ATR of ₹25 gives 100 shares, worth ₹50,000. The more volatile stock gets the smaller position, and a normal day against you costs about the same in each.
Fractional Kelly in practice
The Kelly criterion sets the share of capital to risk from two numbers: the chance of winning and the ratio of the average win to the average loss.
A strategy that wins 55% of the time with wins one and a half times its losses has a Kelly fraction of 0.55 − 0.45 ÷ 1.5 = 0.25, or 25% of the account at risk on each trade. No experienced trader risks that much. The formula assumes the win rate and payoff are known exactly, while a trader's estimates come from a backtest and a few months of live results, and both are uncertain. A strategy whose true edge is half what the backtest showed, traded at full Kelly, can lose most of the account in an ordinary losing run. That is why traders who use Kelly use a small fraction of it, and why most rule-based traders end up at 0.5% to 2% risk anyway. The guide to Kelly criterion position sizing works through the formula and its limits.
Sizing option selling positions
Sold options need the most care, because the loss at a stop can be overtaken by a gap.
A gap test turns the sizing rule into two rules: the loss at the stop must fit the budget, and the loss on a plausible gap must fit a wider limit, such as 3% of the account. If the gap loss is too large, the answer is a smaller size or a hedge. A bought wing turns the straddle into an iron fly with a known maximum loss, which can be sized on that maximum instead of on the stop.
Sizing a bought option on the whole premium
A bought option cannot lose more than its premium, which offers a simple and conservative rule: size so that losing the whole premium costs no more than the budget. With a ₹5,000 budget and a premium of ₹120 on a lot of 65, the whole premium on one lot is ₹7,800, so the rule allows no lot at all at 1%, and one lot needs a budget of 1.56%. Sizing on the exit premium instead, as the calculator does, allows 2 lots with a ₹90 exit. Which to use depends on how reliably you exit: on expiry day, when premiums can halve in minutes, the whole-premium rule is the safer one.
When to change your risk per trade
The risk figure should be stable. Changing it after every result turns sizing into a bet on the next trade. A few reasons to change it are sound:
- The account has grown or shrunk a lot. Fixed fractional sizing already adjusts the rupee budget; the percentage itself can stay the same.
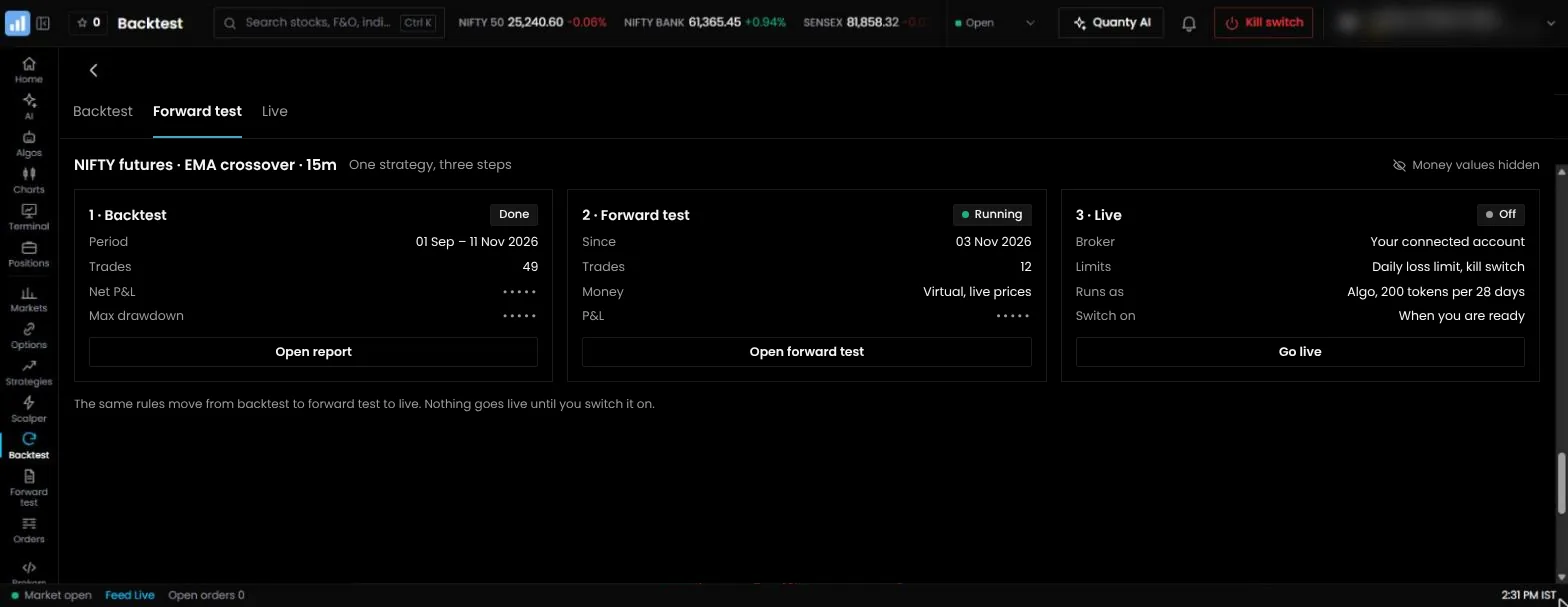
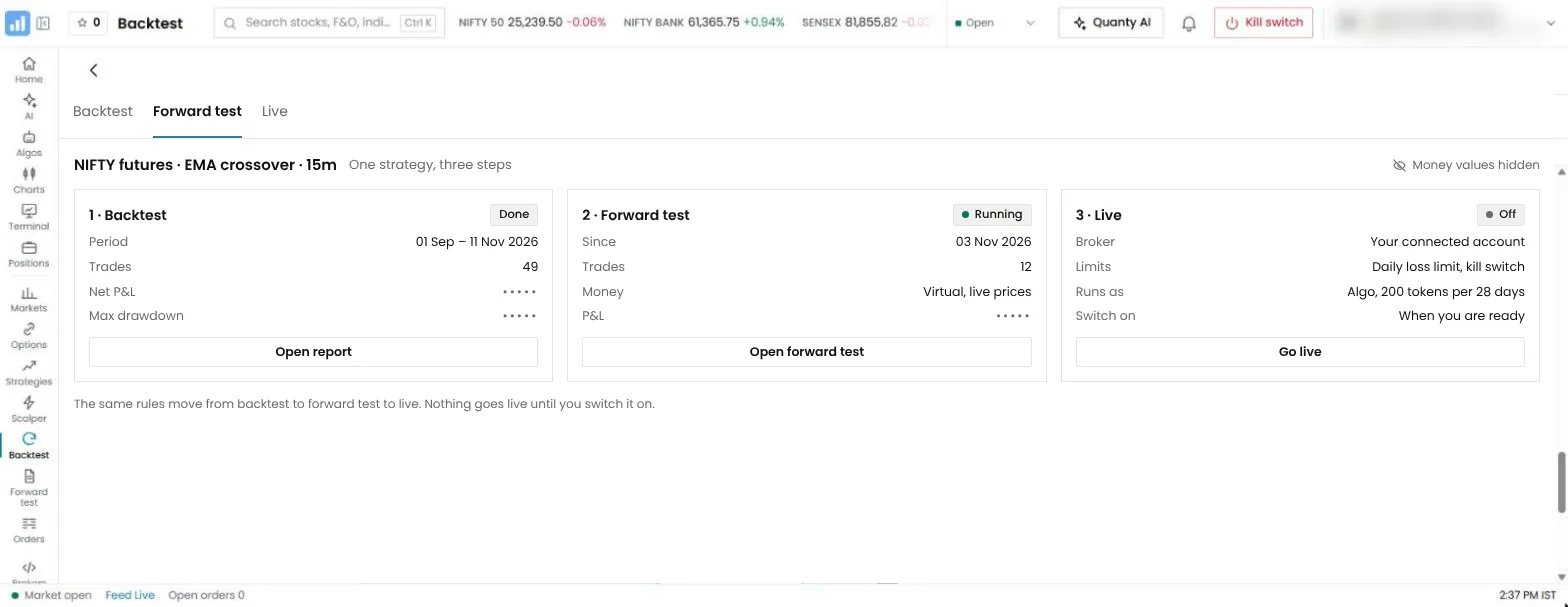
- The strategy is new. Start a new strategy, or one just moved from Forward test to live, at half the usual risk until its live results match its tests.
- Conditions have changed. Before a known event, such as a Budget or a policy decision, many traders halve their risk or step aside.
- A drawdown has reached your limit. A rule such as "halve the risk after a 10% drawdown, restore it at a new high" slows the losses of a strategy that has stopped working.
Several positions at once
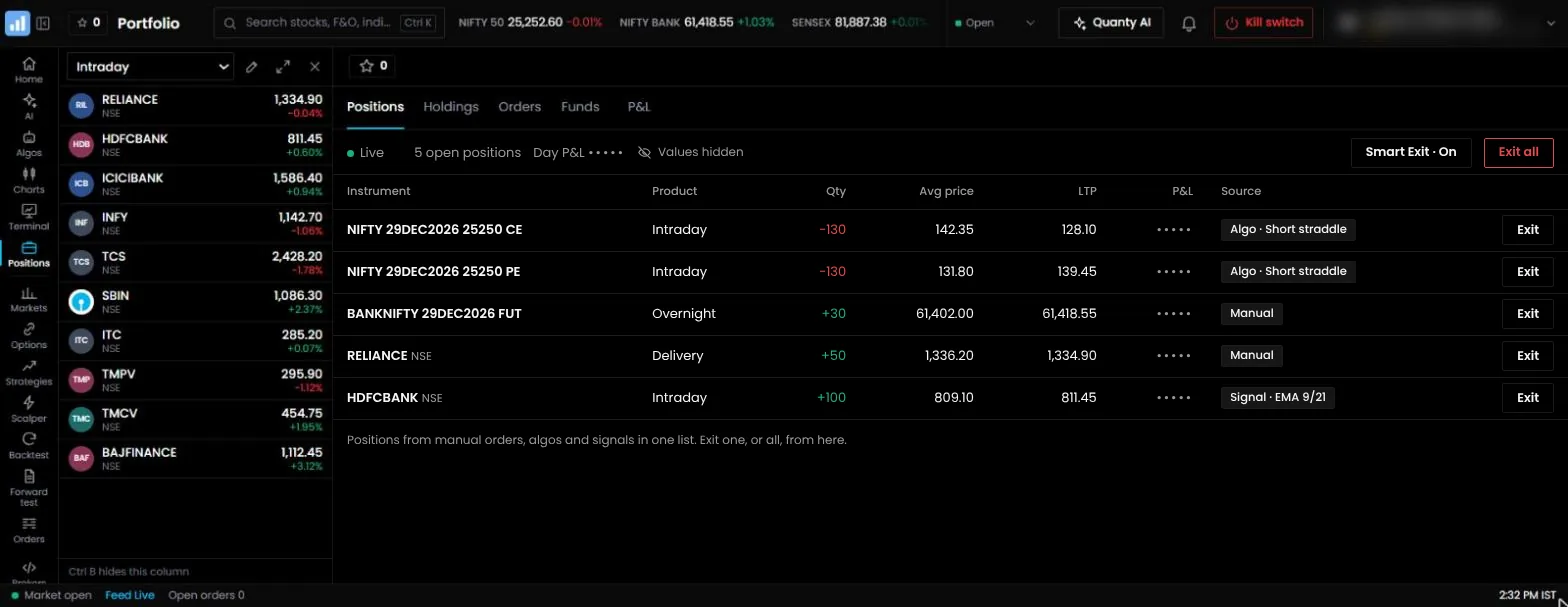
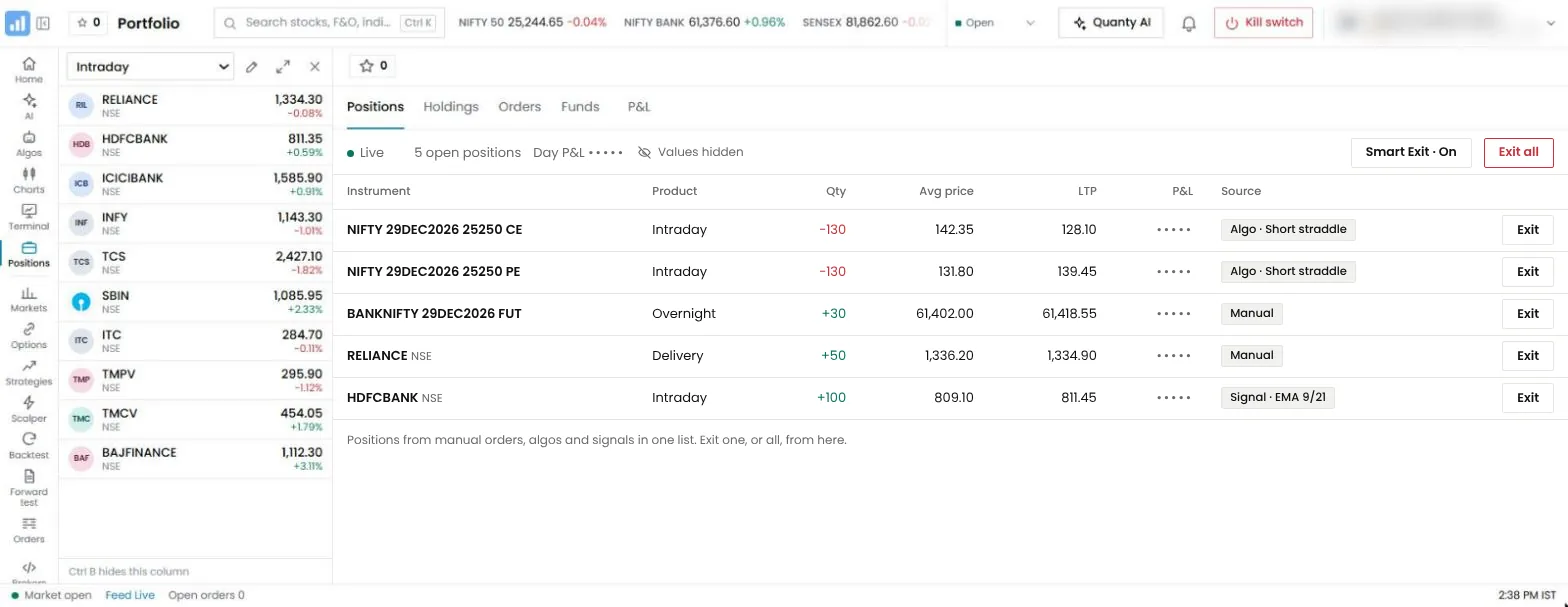
The risk on one trade is only part of the picture. Add up the loss at the stop of every open position: traders call the total the account's heat.
- Cap the total. A common rule is no more than 5% to 6% of the account at risk across all open positions, whatever the risk on each.
- Count correlated trades as one. Long Nifty futures and long Bank Nifty futures will usually lose together. Two 1% risks on them behave more like one 2% risk.
- Count options by their worst case. A short strangle's risk at the stop can be exceeded on a gap; include a gap scenario in the total.
- Leave room. If the heat is at the cap, the next trade waits until an open one is closed or its stop has moved to cost.
A worked example: a swing trade in a stock
A trader with ₹5,00,000 and a 1% rule plans to buy a stock at ₹1,385, with a stop two ATRs below at ₹1,325, where the ATR is ₹30.
- Budget: ₹5,000.
- Risk per share: ₹60.
- Size: 5,000 ÷ 60 = 83 shares, worth about ₹1,14,955.
- Charges: delivery charges on the round trip add a few hundred rupees; include them in the plan.
- Gap check: if results are due before the next session and the stock opens 6% lower, at about ₹1,302, the loss is about ₹6,897, or 1.4% of the account, not 1%. The trader either accepts that, reduces the size before the event, or waits until after it.
The size is not a forecast of the trade. It is the decision about how much this one trade can cost. If the stock moves in the trader's favour, the stop can be raised to cost, which turns the remaining risk on this trade to roughly zero and frees room under the total cap for the next one.
Sizing your algos in QuantPower
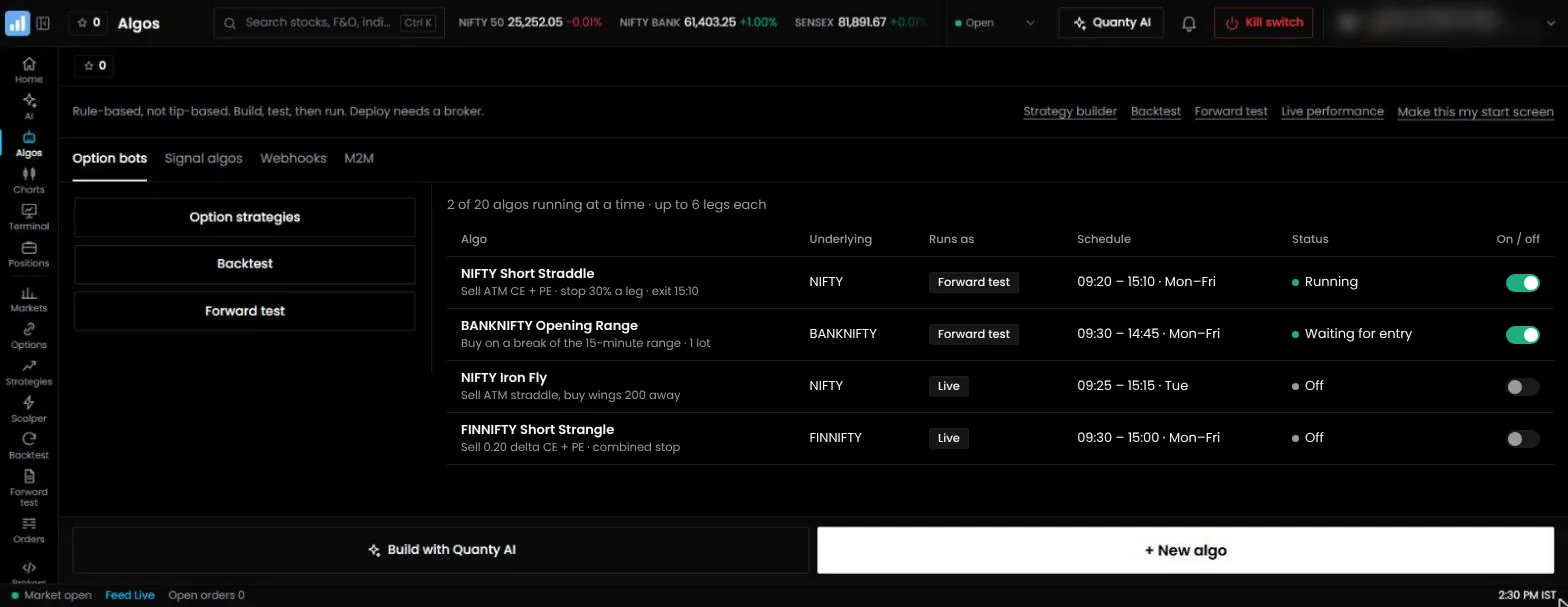
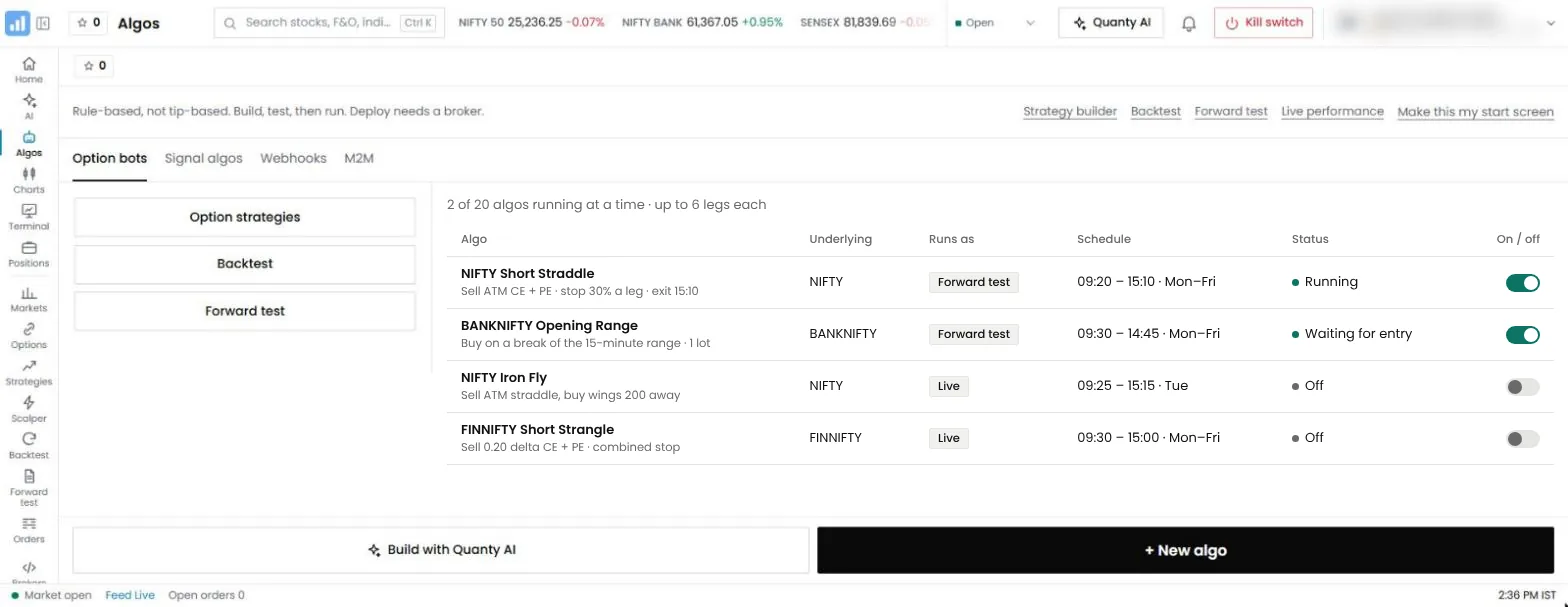
The same rule applies to an algo. In QuantPower each leg of an algo has its lots, and a quantity multiplier from 1 to 50 scales every leg together, along with the algo's rupee targets and stops. Work out the loss at the algo's M2M stop for one unit of the multiplier, divide your budget by it, and round down. Above every algo, the account's daily loss limit refuses new orders once the day's loss reaches it, and Smart Exit squares off and stops the algos when the whole account hits its stop, across every connected broker. These are the account-level version of position sizing: a cap on the day, not only on the trade. The strategy builder and the calculators are free; tokens pay for running algos, 200 per algo per 28 days live (see pricing).
Common position sizing mistakes
- Sizing by margin. The margin you have says how much you can trade, not how much you should.
- Moving the stop to fit the size. Decide the stop from the chart, then the size from the stop, never the other way round.
- Rounding up. One extra lot can take the risk well past the budget. Round down.
- Raising size after losses to win it back. The fixed fraction should fall after losses, not rise.
- Ignoring the total. Five trades at 1% each that all lose together are a 5% day.
Start with 500 free tokens
Connect your broker, build a strategy and test it on paper before a single live order goes out.
Frequently asked questions
How do I calculate position size?
Multiply your account by the share you will risk to get the risk budget, then divide it by the distance from entry to stop loss. For futures and options, divide the units by the lot size and round down.
How much should I risk per trade?
Most rule-based traders risk 0.5% to 2% of the account. At 1%, ten losses in a row leave about 90% of the account.
How do I size an options trade?
For a bought option, use the premium you pay and the premium at which you will exit as the entry and the stop. For a sold option, size by your stop, test a gap in the index, and check the margin.
Why does the calculator round down to whole lots?
Rounding up would take the loss above your budget. If one lot already risks more than the budget, the size is zero.
Does position sizing guarantee my maximum loss?
No. A stop can fill worse than its price in a fast market or after a gap, and charges add to the loss. Allow for slippage when you set the stop distance.
Should I size by margin or by risk?
By risk. Margin is what the broker blocks to hold the position. The loss you can take is set by the stop and the size, and one lot of Nifty futures controls a position worth more than ₹16 lakh.
Should I use the same risk on every strategy?
Not necessarily. A strategy with a long, tested record can carry the standard risk, while a new one starts at half. What matters is that each strategy's risk is set in advance and the total across open positions stays within your limit.
How do I size an algo with several legs?
Work out the loss at the algo's M2M stop for one unit of its quantity multiplier, then divide your risk budget by it and round down. Add a gap test for sold legs.
What is the difference between position size and leverage?
Position size is the number of shares or lots. Leverage is the position's value divided by your capital. A 1-lot Nifty futures trade in a ₹5,00,000 account has leverage of about 3.3 times, even though it risks only ₹3,900 at the stop.
Related guides
- Lot size meaning: how lot sizes are set
- Options risk management: limits for whole positions and the account
- Stock profit calculator: the result of a share trade after charges and tax
References
- John L. Kelly Jr., "A New Interpretation of Information Rate", *Bell System Technical Journal*, 35(4), 917–926 (1956)
- Edward O. Thorp, *Beat the Dealer* (1962), and later papers on the Kelly criterion in markets
- Michael W. Covel, *The Complete TurtleTrader* (2007), on the Turtles' volatility-based position units
- Ralph Vince, *Portfolio Management Formulas* (1990), on fixed fractional sizing
- Van K. Tharp, *Trade Your Way to Financial Freedom* (1998)
- NSE: revision in market lot of index derivative contracts from the January 2026 series (Nifty 65, Bank Nifty 30) (nseindia.com)
- Brokerage and statutory charges as in the QuantPower brokerage calculator, rates from 1 April 2026