The option chain is free in QuantPower: it costs no tokens. Its prices come live from your own connected broker. With no broker connected, the chain has no live prices to show; you can explore the screens with the "Explore" option that opens the app with sample data, where every row is tagged "Sample data" and no order can be placed.
Before you start
- A connected broker, signed in today, for live prices, open interest and Greeks.
- The basics of options. If calls, puts, strikes and expiry are new, read the guide to how to read an option chain first. This tutorial is about the QuantPower screen.
- A question to answer. "Where is most of the put open interest?", "What move is the market pricing for this week?", "Which strike gives a premium of about ₹100?" A chain is easier to read with a question in mind.
What the option chain screen holds
| Part | What it shows |
|---|---|
| Underlying and expiry | The index or stock, and the expiry date, with "Expires today" or "Expires tomorrow" flags |
| Analytics strip | ATM IV, the ATM straddle, PCR (OI), max pain, the highest call and put open interest, expected move, net gamma exposure and the zero-gamma level |
| The chain | Calls on the left, puts on the right, strikes down the middle |
| Views | Price, OI & Volume, or Greeks |
| Futures row | The current future, for the futures premium |
| Settings | Prices per unit or per lot, and the chain quantity |
A short history of the option chain
Listed options are younger than most traders think. The Chicago Board Options Exchange opened in 1973, the first exchange with standardised, listed options, and the Black-Scholes pricing model was published the same year.1 The option chain, a table of every strike's call and put side by side, grew out of the quote boards and newspaper tables that showed those listings.
In India, index options began on the NSE in June 2001, and stock options a month later.2 For many years the NSE's own website was where most traders read the chain. Weekly expiries, open interest analysis and the rise of option selling by individual traders turned the chain into the most-watched screen in Indian trading. In November 2024 SEBI limited each exchange to one weekly expiry, and from September 2025 NSE expiries moved to Tuesday, with BSE on Thursday.3 A chain today is read against those rules.
Step 1: Open the chain and choose the underlying
Open Options from the menu. The overview lists the indices (Nifty, Bank Nifty, Fin Nifty, Midcap Nifty and Sensex) and the stocks with options. Tap Nifty. The chain opens on the nearest expiry, centred on the at-the-money strike, with the analytics strip above it.
To switch later, tap Change underlying at the top of the chain. The search finds any index or stock with options.
Step 2: Choose the expiry
Tap Change expiry. The list shows each expiry, with weekly and monthly expiries marked, and "Expires today" or "Expires tomorrow" where it applies.
Since 20 November 2024, each exchange lists weekly options on one index only: Nifty on the NSE and Sensex on the BSE. Bank Nifty, Fin Nifty and Midcap Nifty have monthly expiries. NSE contracts expire on Tuesdays and BSE contracts on Thursdays, moved earlier when the day is a holiday.
The nearest expiry has the most trading and the fastest time decay. A later expiry moves more slowly and costs more. Choose the expiry that matches the time your view needs to play out. A view about this afternoon belongs in the nearest weekly; a view about the next month belongs in the monthly.
Step 3: Find your way around the chain
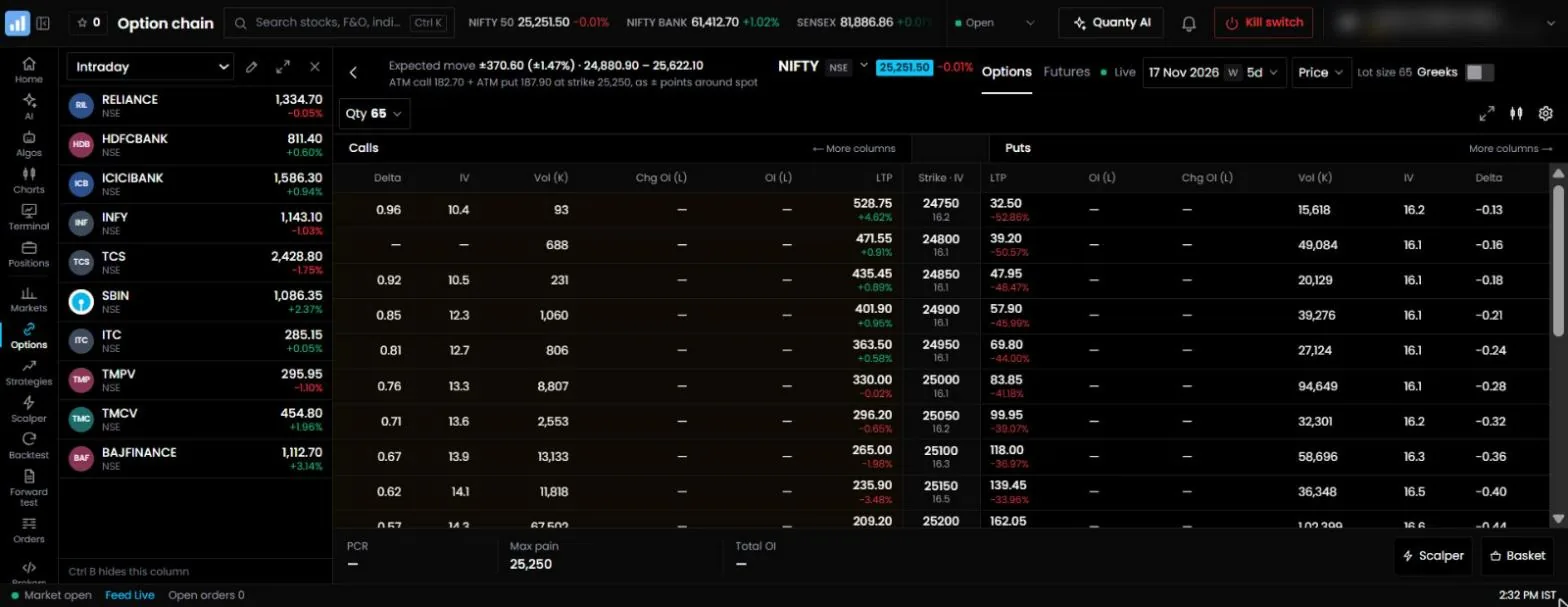
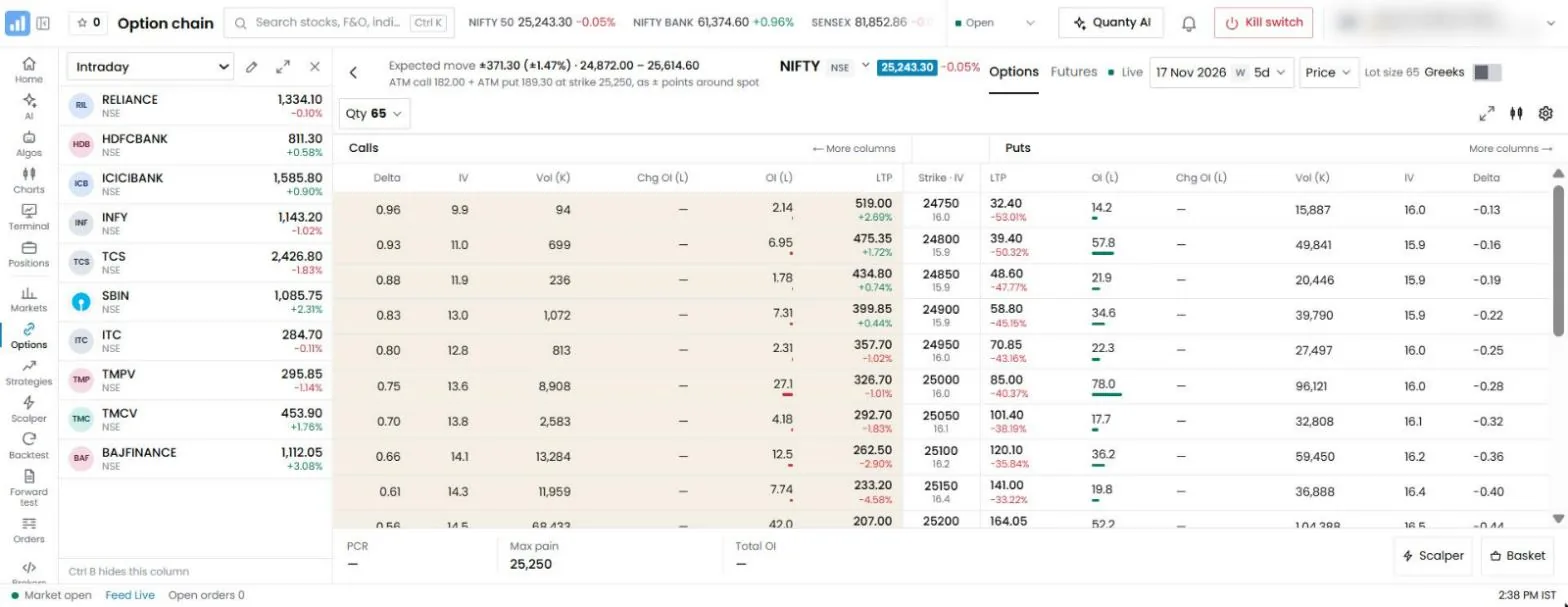
The chain is centred on the at-the-money strike, the one closest to the current price. Strikes below it are in the money for calls and out of the money for puts; strikes above it are the opposite.
| Area | Calls | Puts |
|---|---|---|
| Strikes below the price | In the money | Out of the money |
| At the money | Nearest to the price | Nearest to the price |
| Strikes above the price | Out of the money | In the money |
In-the-money rows are shaded, so you can see where the price sits at a glance. Scroll up and down for more strikes. The futures row shows the current future's price; the difference between the future and the index is the futures premium, which reflects interest and expected dividends until expiry.
Step 4: Switch between the three views
The Chain view setting switches the columns:
| View | Columns | Use it to |
|---|---|---|
| Price | Last price and change for each call and put | Find premiums, see which strikes are moving |
| OI & Volume | OI in lakhs, change in OI in lakhs, volume in thousands | See where positions are building or closing |
| Greeks | Delta, gamma, theta and vega | Pick strikes by delta, see time decay and volatility exposure |
You can also show prices per unit or per lot. Per lot is useful when you think in rupees: a call at ₹120 with a lot of 65 units costs ₹7,800 a lot.
Step 5: Read the price view
In the price view, each call and put shows its last traded price and its change for the day. Three readings are worth making first:
- The ATM straddle. Add the at-the-money call and put. That sum is the price of a straddle, and the analytics strip shows it directly. It is the clearest single number for how much movement the market expects by expiry.
- Where premiums fall away. Out-of-the-money options lose value quickly as you move away from the price. The strike where the premium falls below a few rupees is roughly where the market sees little chance of the price reaching by expiry.
- Skew between calls and puts. Compare an out-of-the-money put and call the same distance from the price. In Indian indices, puts usually cost more than calls at the same distance, because traders pay more for protection against falls.
Step 6: Read open interest
Switch to OI & Volume. Open interest is the number of contracts still open at each strike. Change in OI shows whether positions were added or closed today.
| Reading | What it usually means |
|---|---|
| Large call OI at a strike above the price | Many calls written there: traders who sold them expect the price to stay below |
| Large put OI at a strike below the price | Many puts written there: traders who sold them expect the price to stay above |
| Rising OI with a rising premium | New buying |
| Rising OI with a falling premium | New writing |
| Falling OI | Positions being closed |
The analytics strip names the strike with the highest call open interest, often called the call wall and read as resistance, and the strike with the highest put open interest, the put wall, read as support. These are readings of where positions sit, not promises about where the price will stop. The guide to Nifty PCR and open interest explains how traders read them together.
Step 7: Read the analytics strip
| Figure | What it is | How traders use it |
|---|---|---|
| ATM IV | The implied volatility of the at-the-money options | How expensive options are now compared with other days |
| ATM straddle | The at-the-money call plus put | The market's price for movement by expiry |
| Expected move | The range the straddle price implies by expiry | A rough band the market is pricing, not a forecast |
| PCR (OI) | Put open interest divided by call open interest | Whether more puts or more calls are open |
| Max pain | The strike where option buyers as a whole would lose the most at expiry | A reference some traders watch near expiry |
| Highest call OI | The call wall | Read as resistance |
| Highest put OI | The put wall | Read as support |
| Net GEX | Net gamma exposure of option sellers | "Long gamma, calmer" or "Short gamma, faster moves" |
| Zero gamma | The level where net gamma changes sign | Where the market's behaviour may change |
Two cautions. A PCR above 1 means more puts are open than calls; it does not by itself say whether the market will rise or fall, because puts are bought for protection and sold for income. And max pain is a reading of open interest, not a force on the price; on many expiries the index closes far from it.
Expected move, worked
Suppose Nifty is at 25,500 four days before expiry, and the ATM straddle is ₹260. The expected move by expiry is roughly the straddle price: about ±260 points, or a band from about 25,240 to 25,760. A short straddle at that strike breaks even near the edges of that band, before costs. If you think the index will move more than that, the options are cheap for your view; if less, they are expensive.
Step 8: Read the Greeks
Switch to Greeks.
| Greek | What it measures | A reading |
|---|---|---|
| Delta | How much the option moves for a 1-point move in the index | A call with delta 0.30 moves about ₹0.30 for 1 point |
| Gamma | How fast delta changes | Highest at the money and near expiry |
| Theta | Value lost per day from time, all else equal | A short option earns it; a long option pays it |
| Vega | Value change for a 1-point change in implied volatility | Long options gain when IV rises |
Delta is also a quick estimate of the chance the option ends in the money. Many option sellers choose strikes by delta, such as selling the 0.15 to 0.20 delta call and put for a strangle. QuantPower's algo legs can pick a strike by delta in the same way, at each entry.
Step 9: Read buildup on the futures
The buildup labels show what the day's change in price and open interest says about the futures:
| Price | Open interest | Label |
|---|---|---|
| Up | Up | Long buildup |
| Down | Up | Short buildup |
| Up | Down | Short covering |
| Down | Down | Long unwinding |
Read buildup on the futures beside the chain to see whether the day's move comes from new positions or from old ones being closed. A rise on short covering can fade once the covering is done; a rise on long buildup has new money behind it.
Choosing a strike: five ways
The chain shows every strike, but most traders choose with one of a handful of rules. QuantPower's algo legs use the same rules to pick a strike fresh at each entry, so what you practise by hand on the chain can later run on its own.
| Way to choose | How it works on the chain | Algo leg choice |
|---|---|---|
| At the money | The strike nearest the price | ATM |
| A number of strikes away | Count strikes up or down from the money | ITM n or OTM n, 1 to 20 strikes |
| By premium | Find the strike whose price is nearest a figure, such as ₹50 | Premium: nearest to, at or above, or at or below |
| By delta | Find the strike whose delta is nearest a figure, such as 0.20 | Delta, or theta, gamma or vega |
| By straddle width | Move away from the money by a multiple of the ATM straddle | Straddle width, or a % of the straddle |
Each rule has a reason. Choosing by premium keeps the money at risk similar from week to week, whatever the volatility. Choosing by delta keeps the chance of being in the money similar. Choosing by straddle width keeps the distance in line with the move the market is pricing. Choosing a fixed number of strikes is simplest, but its meaning changes as volatility changes: two strikes away is far on a quiet day and close on a volatile one.
The price the strike is counted from matters too. An algo can count from the spot index, from the future, or from a synthetic future (the ATM call minus the ATM put plus the ATM strike). On most days they are close; on days with a large futures premium or around dividends they can differ by a strike or more.
Reading implied volatility across strikes
Implied volatility is not the same at every strike. In the Greeks view or the analytics, compare the IV of an out-of-the-money put, the at-the-money options and an out-of-the-money call:
- Puts below the price usually have a higher IV than calls above it. Traders pay more for protection against falls than for exposure to rises. The pattern is called skew.
- IV rises before events such as a budget, an election result or a central bank decision, and usually falls sharply after. Option buyers who hold through the event often lose from the fall in IV even when the index moves in their favour. The guide to IV crush explains why.
- The nearest expiry's IV reacts most. A later expiry's IV moves less for the same news.
ATM IV in the analytics strip is a good single number for how expensive options are. Compare it with recent days rather than with a fixed figure: what counts as high for Nifty is low for a single stock.
The chain on expiry day
Expiry day changes how the chain behaves, and the same readings mean different things:
- Time decay is fastest. At-the-money options can lose a large part of their remaining value in the last few hours. Theta in the Greeks view is at its largest.
- Gamma is highest at the money. A small move in the index moves at-the-money options sharply. Net GEX and the zero-gamma level are watched most closely on expiry day for this reason.
- Far strikes go to almost nothing. Options a few hundred points out of the money trade at a rupee or less, and their open interest stops meaning much.
- Open interest shifts quickly. Writers close and roll positions during the day, so the call and put walls can move by a strike or two in an hour.
- Margins rise for sellers. SEBI's rules add an extra 2% margin on short index options on expiry day.3
Many traders read the expiry chain mainly through the ATM straddle: if it falls through the day, the market is settling; if it rises in the afternoon, a larger move is being priced in.
On a phone
The chain works the same way on a phone, with fewer columns at a time. Switch views with the Chain view setting to move between price, open interest and Greeks rather than trying to see all three at once. The analytics strip scrolls sideways above the chain. Tap a row for the same actions as on a laptop: buy, sell, open the Scalper or the chart, or add the legs to the strategy builder.
A daily routine with the chain
- Before the open: read yesterday's closing open interest for the nearest expiry, and note the call and put walls.
- After the first fifteen minutes: read the change in open interest. Where are writers adding, and where are they closing?
- Mid-morning: read ATM IV and the ATM straddle against the open. Is the market pricing more movement or less?
- Before any option trade: check the strike's volume, the spread between bid and ask, and the lot cost in rupees.
- In the last hour on expiry day: watch the ATM straddle and gamma; decide in advance what you will do if the index moves sharply.
Step 10: Turn a reading into a trade
Tap a row in the chain. You can:
- Buy or sell the call or put. The order sheet opens with the strike filled in; set the quantity in lots and confirm.
- Open the Scalper for that strike, with the call and put charts side by side, for fast manual trades.
- Open the chart of the option.
- Add the legs to the strategy builder, to see the payoff of a spread or a straddle before you place it.
From the strategy builder, Run as algo turns the legs on the payoff screen into an algo, which you can test in Forward test or switch on live.
A worked example: a weekly short strangle by delta
This example is hypothetical, to show the steps, not a recommendation.
- Open the Nifty chain and choose the nearest weekly expiry.
- Switch to Greeks. Find the call with a delta close to 0.15 above the price, and the put with a delta close to −0.15 below it. Suppose they are the 26,000 call and the 25,000 put.
- Switch to Price. The call shows ₹42 and the put ₹48. The combined premium is ₹90, or ₹5,850 for one lot of 65.
- Check the analytics: the expected move is ±260 points, so both strikes sit outside the band the market is pricing.
- Switch to OI & Volume. The 26,000 call has the highest call open interest (the call wall), and the 25,000 put is near the put wall. Both strikes are where many sellers already sit.
- Add both legs to the strategy builder to see the payoff and the margin. Decide the stop for each leg, then either place the two orders by hand or turn the legs into an algo with a stop on each leg and an exit time.
The chain gave the strikes, the premium, the band the market is pricing and where other sellers sit. The decision, the size and the stops are the trader's.
A worked example: reading a sharp morning move
At 9:35 Nifty has fallen 180 points from the open.
- In OI & Volume, put open interest at the 25,300 strike rose sharply in the first twenty minutes, and call open interest at 25,500 also rose. Writers are adding puts below and calls above.
- In the analytics strip, ATM IV has risen and the ATM straddle is ₹40 higher than at the open: options are pricing more movement.
- The futures show short buildup: price down, open interest up. New short positions are behind the fall.
None of this says what happens next. It says the fall has new positions behind it and options have become more expensive, which a trader planning to sell options or buy protection would want to know.
A worked example: a Bank Nifty monthly spread
Bank Nifty has monthly expiries only, so its chain is read over weeks rather than days. A trader with a mildly bullish view three weeks before the monthly expiry wants a defined-risk position.
- Open the chain, change the underlying to Bank Nifty and choose the monthly expiry.
- In the price view, find the at-the-money call and a call about 500 points higher. Suppose the 56,000 call trades at ₹780 and the 56,500 call at ₹520.
- A bull call spread buys the 56,000 call and sells the 56,500 call: a net cost of ₹260 a unit, or ₹7,800 for one lot of 30.
- The most the spread can gain at expiry is the width less the cost: 500 − 260 = ₹240 a unit, or ₹7,200 a lot. The most it can lose is the cost, ₹7,800 a lot.
- Add both legs to the strategy builder to see the payoff line, the breakeven (56,260 at expiry) and the margin, which is lower than for a naked short call because the bought call hedges it.
When placing the two legs, buy the 56,000 call first and sell the 56,500 call after. Baskets and algos place buy legs before sell legs for this reason: a refused hedge then never leaves a naked short option.
Settings worth changing
The Chain settings menu has a few options that make the chain easier to read for your own trading:
- Prices per unit or per lot. Per lot shows what one lot costs in rupees, which suits traders who size by money rather than by units.
- Chain quantity. Set the number of lots the chain uses when you tap Buy or Sell, so the order sheet opens with your usual size.
- Chain view. Switch between Price, OI & Volume and Greeks. On a phone, one view at a time is easier to read than trying to see every column.
Set them once for the way you trade, and check them again when you change the size you trade.
Common mistakes
- Reading one figure alone. PCR, max pain or one strike's OI means little without price, IV and the change in OI beside it.
- Treating the call and put walls as fixed levels. Open interest moves during the day; walls shift.
- Ignoring liquidity. A far strike with little volume can have a wide spread between bid and ask. The last price may not be where you can trade.
- Forgetting the lot size. A premium of ₹40 is ₹2,600 a lot of Nifty at 65 units, and ₹1,200 a lot of Bank Nifty at 30 units.
- Holding stock options into expiry by accident. Stock options settle by delivery; index options settle in cash.
Common problems
| Problem | What to check |
|---|---|
| The chain is empty | A connected broker is needed for prices. Check the broker is signed in today |
| Greeks are blank for some strikes | Greeks need a recent price; far strikes with no trades may have none |
| OI does not change during the day | Exchanges publish open interest at intervals, not on every trade |
| The expiry is missing | It may have expired today. Choose the next expiry |
| "Sample data" shows on every row | Sample data is on. Connect your broker to see real prices |
| An order on a stock option is refused | The stock may be in the F&O ban: only reducing orders are accepted |
Where option chains are going
Two changes are clear. More of the reading that traders once did by hand, such as straddle prices, expected moves, gamma exposure and buildup, now sits on the chain itself. And SEBI's changes to expiries and contract sizes since 2024 have concentrated trading in fewer contracts, which makes each remaining weekly expiry's chain more important to read well.3
Next steps
- Read the guide to the Nifty option chain.
- Read the Bank Nifty option chain guide for monthly-expiry readings.
- Build a strategy from chain legs with the create-strategy tutorial.
Start with 500 free tokens
Connect your broker, build a strategy and test it on paper before a single live order goes out.
Frequently asked questions
Can I see the option chain for stocks as well as indices?
Yes. Change the underlying to any stock with options. Stock options have monthly expiries and settle by delivery if held in the money at expiry.
Why do some strikes show no Greeks?
Greeks are calculated from a recent price. A far strike that has not traded recently may show none until it trades.
Can I place a multi-leg trade from the chain?
Yes. Add the legs to the strategy builder from the chain to see the payoff and margin, then place them together, or run them as an algo.
What does "In ban" mean on a stock's options?
A stock is in the F&O ban period when the open interest in its derivatives passes 95% of the exchange's market-wide limit. During a ban, you can only reduce existing positions in that stock's futures and options, not add new ones. Orders that would add to a position are refused until the stock leaves the ban.
Does the option chain cost tokens?
No. The option chain, its analytics and the strategy builder are free. Tokens are used for live algos, Forward test algos, backtests and Quanty questions.
Related guides
References
- Cboe Global Markets, history: the CBOE opened on 26 April 1973 (cboe.com)
- NSE, history of the derivatives segment: index options from June 2001, stock options from July 2001 (nseindia.com)
- SEBI, circular on strengthening the equity index derivatives framework, 1 October 2024; NSE circular on the revision of expiry days, effective 1 September 2025 (sebi.gov.in, nseindia.com)