Your positions stay with your broker. QuantPower reads them from each broker you connect, shows them with their mark-to-market profit or loss as prices move, and puts every action you might need on the same screen: exit one position, convert its product, or exit everything. Above the list sit the account-wide controls that act when you are not looking: a daily loss limit, Smart Exit with a target, a stop and a trail for the whole account, and a kill switch. The loss figure behind them adds up every broker you have connected, so two accounts cannot hide a loss from each other.
What position monitoring in QuantPower does
| Part | What it does |
|---|---|
| Positions | Today's positions at each broker, with quantity, average price, last price and mark-to-market P&L |
| Group by strategy | Positions grouped under the algo that opened them, with each group's own M2M, and manual trades in a group of their own |
| Actions on a position | Exit it, or convert its product, for example from Intraday to Overnight |
| Exit all | Stops your running algos first, then squares off everything, or one segment |
| Holdings | Your portfolio with profit and loss and totals; a holding can be pledged for margin |
| Funds | Margin, collateral, cash and what can be withdrawn |
| Algo cards | Each algo's state, today's legs with their fills, its M2M and an activity log |
| P&L history | Realised P&L per day and per month from your own fills, with a CSV download |
| Share Verified P&L | A public page and image of your P&L, worked out from your broker fills and frozen |
| Account-wide controls | Daily loss limit, Smart Exit, kill switch and an optional cap on orders a day |
| Several brokers | One view across every connected broker; each exit goes to the broker that holds the position |
| Price | Free: no tokens |
A short history of keeping track of positions
Every trader since the first market has needed to know two things: what he holds, and what it is worth now. The written answer to the first question goes back to double-entry bookkeeping, which Luca Pacioli described in print in 1494. Every purchase is recorded twice, once as what was bought and once as what was paid, so the books always balance.1
The second question, what a position is worth today, became a rule with the futures exchanges. A futures contract is settled years or months away, but a clearing house cannot wait that long to find out whether a trader can pay. Clearing houses therefore began to mark every open position to the day's settlement price and collect the loss, or pay the gain, every day. The Chicago Board of Trade's clearing corporation, set up in 1925, made daily settlement a standard part of futures trading.2 "Mark-to-market", or MTM, is the name traders still use for the running profit or loss of a position at today's price.
In India, the clearing corporation of the National Stock Exchange was set up in 1995 to stand between buyers and sellers, and when index futures began in 2000 their positions were marked to market daily from the start.3 For a trader, the more recent change came in 2020 and 2021, when SEBI phased in rules that required brokers to collect margin up front and to check the peak margin used during the day, not only at its end.4 Since then, knowing your position and its margin during the session, not only after the close, has been a requirement as much as a habit.
Reading the positions screen
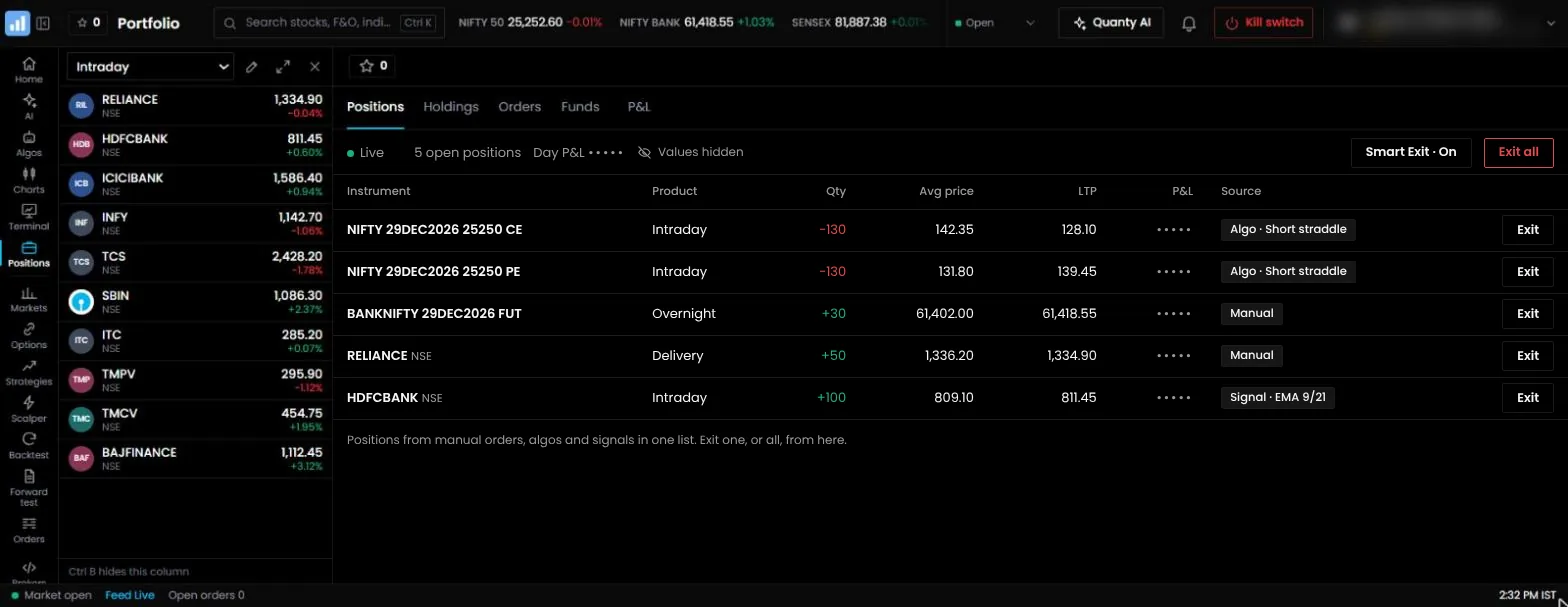
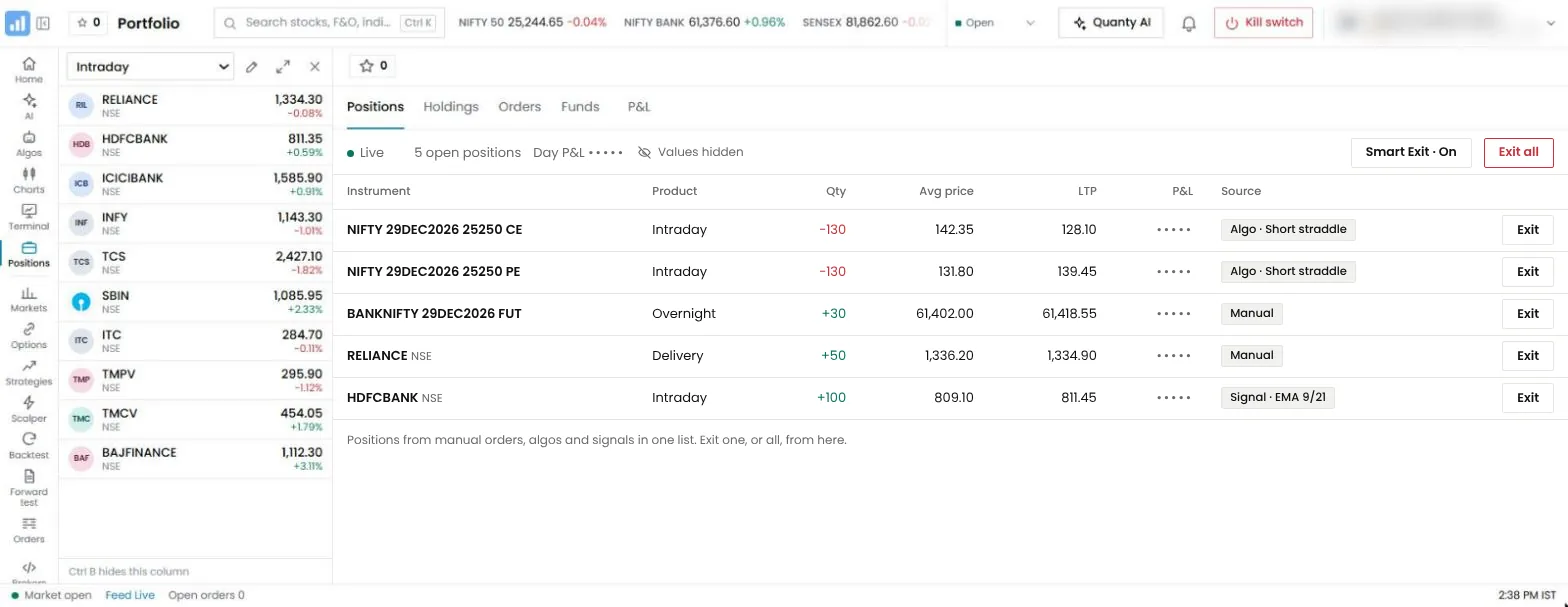
Each row on the positions screen is one open position at one broker:
| Column | What it means |
|---|---|
| Instrument | The share, future or option, with its expiry and strike for derivatives |
| Product | Intraday, Overnight or Delivery, as the position was opened |
| Quantity | Units held; a negative quantity is a short position |
| Average price | The average price of the fills that make up the position |
| Last price | The latest traded price from your broker's feed |
| M2M | The profit or loss at the last price |
The total at the top adds the M2M of every position. With more than one broker connected, positions are shown per broker, and the account total adds them all.
Grouping positions by strategy
Tap Group by strategy and the list is regrouped under the strategy that opened each position: every algo gets its own group with its legs and its own M2M, signal algos have theirs, and positions you opened by hand sit together under Manual. A short straddle shows as one group with its two legs and a combined figure, instead of two rows in a long list. The account total at the top does not change; only the way the rows are arranged does. Tap again to go back to one list by instrument.
Reading live P&L
The P&L on an open position is marked at the last traded price. For a bought position it rises as the price rises; for a sold option it rises as the premium falls. It is not money in your account until you exit, and the exit happens at the best bid or ask, which can differ from the last trade, especially on strikes far from the money.
Multi-leg strategies need to be read as a whole. One leg showing a profit says little about the trade.
Adding up the legs that belong to one strategy gives the strategy's figure. Reading leg by leg can make a losing trade look half right.
Carried positions and the day's M2M
A position you carried from yesterday has two profits: the one since you opened it, and the one since yesterday's close. Brokers differ in which they show as "today's" P&L. Some measure a carried position from the previous day's settlement or closing price, because that is how the exchange marks it each day; others measure it from your entry price. Neither is wrong, but mixing them causes confusion when you compare two screens.
When you check a carried position, ask which figure you are looking at. For risk, today's movement matters: a daily loss limit is about what you lose today. For judging the trade, the movement since entry matters: that is what the trade has made or lost so far. The quantities on every screen must still match exactly, whichever price the P&L is measured from.
Manual and automated positions in one view
Algos and manual trades use the same broker account, so their positions sit in one list, and Group by strategy separates them again by the algo that opened each one. Your broker nets positions by contract, so an algo and a manual trade in the same contract are one position at the broker. The grouping follows each order to its source, so it can still show which part came from the algo; keeping algos and manual trades on different contracts makes the results simplest to read.
Each algo also has its own card, which shows its state, today's legs with their fills, its M2M for the day, and a line for anything it is waiting on. Its activity log records every entry, exit, re-entry, change and refusal in one plain line each. Between the card and the positions screen you can always see both what an algo thinks it holds and what your broker holds.
Each algo manages the positions it opened. If you exit or change one of them by hand, the algo may still act on it, for example by sending an exit for a leg you have already closed. Pause the algo first, or stop it and keep its positions, then act. The tutorial on how to manage open positions walks through each button on the positions screen.
How monitoring works, step by step
- You connect a broker and sign in for the day. QuantPower reads your positions, holdings and funds from it.
- Prices stream in from your broker's feed, and each position's M2M is worked out at the last price.
- Your orders and fills update the list as your broker reports them, so a new entry or exit shows within moments.
- The account-wide controls watch the total. The daily loss limit, Smart Exit and the kill switch read the combined position of every connected broker.
- You act from the same screen: exit, convert, or exit all.
- After the close, the day's fills are stored for your P&L history.
If a broker does not answer, QuantPower says so. It never reads "no answer" as "no positions", and the risk checks refuse new orders rather than assume all is well.
Exiting positions
You can exit a single position, each leg of a strategy such as both legs of a straddle, or every open position at once with Exit all. Each exit is an order through the same order path as any order.
- Exit all stops your running algos first, so none of them re-enters, and then squares off everything, or one segment if you choose. Because it is a large action, it needs your tap and your second factor.
- An exit is an order. It can fill in parts or be rejected, so check the order book after every exit.
- Close short legs before their hedges. Exiting the bought leg first can leave a naked short option and raise the margin needed.
- Expect the bid or ask, not the last trade. In thin strikes the exit price can be worse than the P&L suggested.
- Cancel stops you no longer need. A pending stop or GTT on a closed position can trigger later and open a new one.
With several brokers connected, each exit goes to the broker that holds the position. Nothing is ever sent to a guessed broker.
Converting a position
A position opened as Intraday is squared off by your broker near the close. If you decide to hold it overnight, convert its product to Overnight (for F&O) or Delivery (for shares) from the position's menu, as long as you have the margin or funds for it. The conversion goes to your broker like any other request, and the position keeps its quantity and average price.
Limits that act on what you see
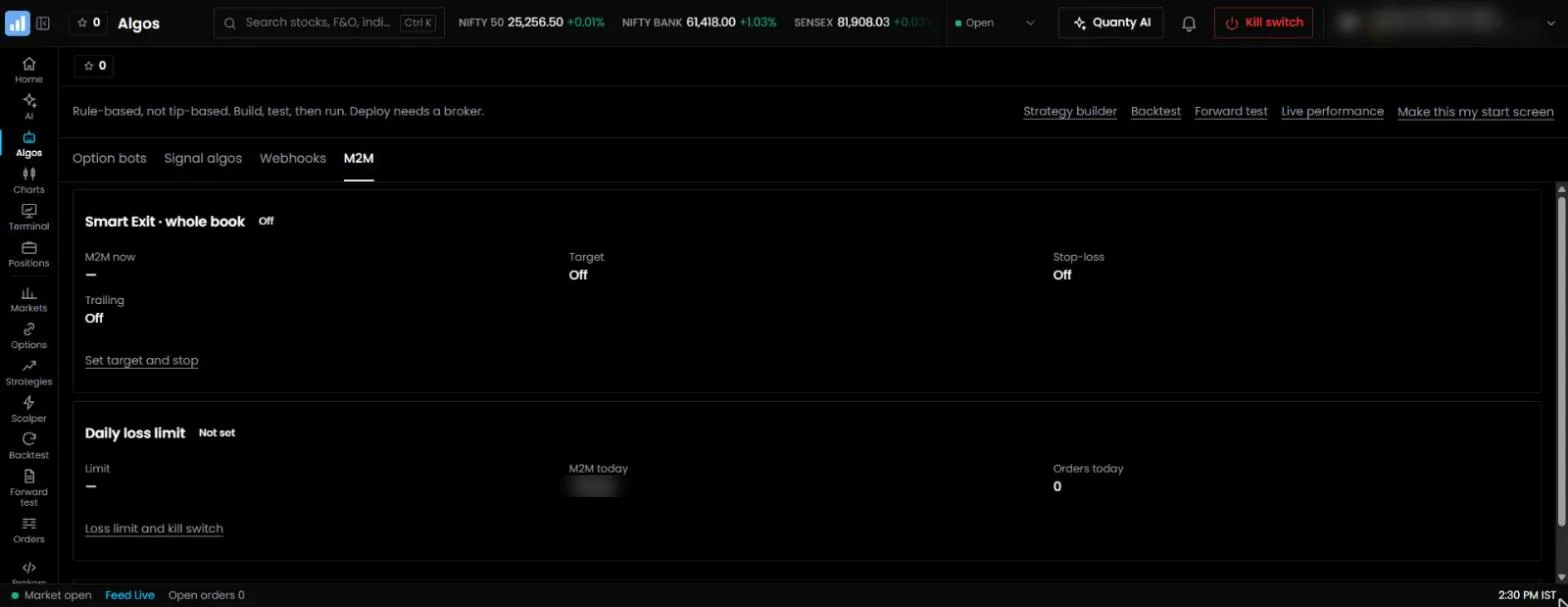
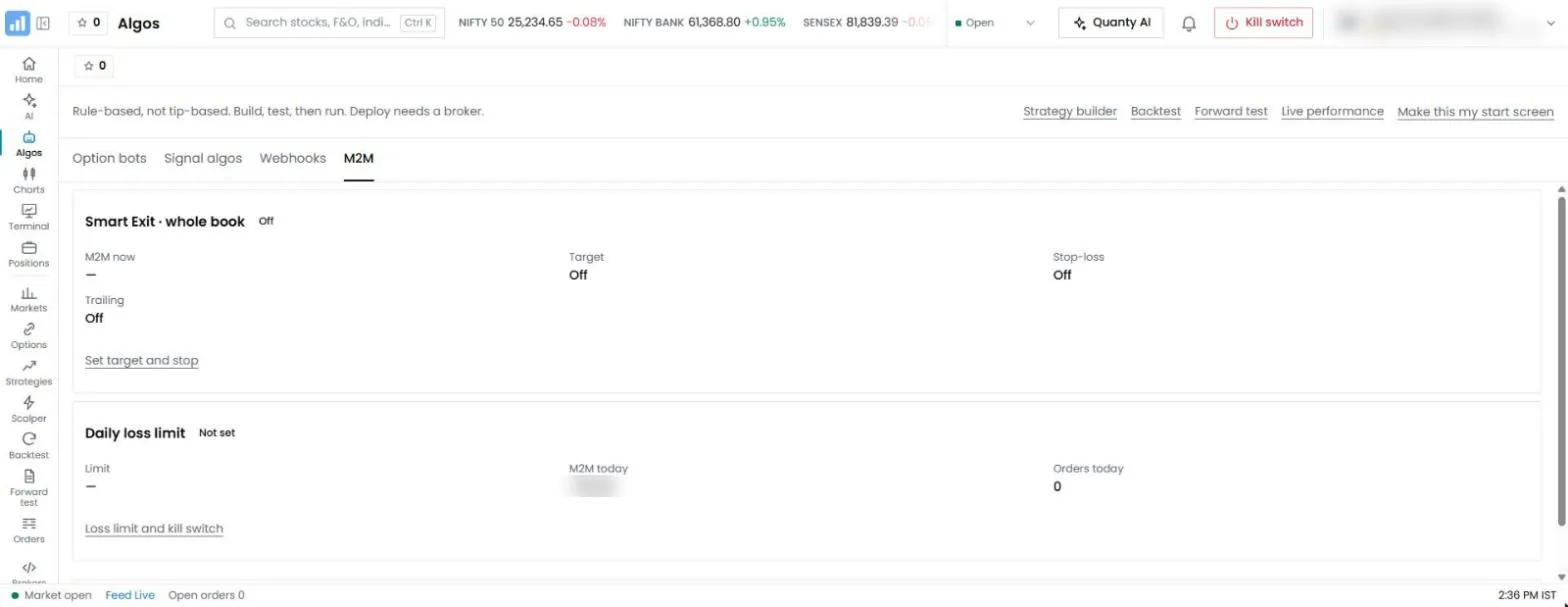
Watching a screen all day is not a risk control. These tools act when you are not looking:
| Control | What it does | Needs |
|---|---|---|
| Daily loss limit | Once today's loss reaches it, new orders are refused | Set once |
| Smart Exit | A profit target, a stop-loss and a trailing step for the whole account; on a hit it stops the algos and squares off | Your tap and second factor to arm |
| Kill switch | Stops trading in the segments you choose until their next session; running algos in them stop | Your second factor |
| Maximum orders a day | An optional cap on orders | Set once |
| Stop-loss orders | Exit one position at its level, at your broker | Placed per position |
| Market alerts | Tell you when a price or indicator rule is reached | Set per instrument |
The loss figure the account-wide controls use is the combined position of all your connected brokers. The MTM stop loss page explains how to set the account-wide levels.
Size positions so that the worst likely day stays inside the limit. The position size calculator works out lots from the loss you can accept. A gap or a rejected exit can still make the final loss larger than a limit.
Holdings and funds
Positions are what you trade today. Holdings are what you own in your demat account, and funds are what you can trade with. QuantPower shows both beside your positions, read from your broker.
- Holdings list your shares and ETFs with quantity, average cost, current value and profit or loss, with totals for the portfolio. A holding can be pledged with your broker as collateral for margin, which lets you use shares you already own towards F&O margin without selling them.
- Funds show the margin available and used, the collateral from pledged holdings, the cash balance and the amount that can be withdrawn. Margin used rises as you open positions and falls as you close them.
QuantPower itself takes no money into a trading account and holds none. Money moves between your bank and your broker as it always has.
Forward test positions
Every QuantPower account also has a Forward test account, which trades with test money: ₹10,00,000 to start. Orders there fill at the price you see and build positions just as a broker's book would, with M2M that moves with live prices.
Forward test positions are kept strictly apart from real ones. Your real positions, holdings, funds and the account-wide risk controls read only your real brokers; the Forward test has its own book and its own P&L history. On the chart, a Forward test position is drawn as its own line marked "Forward test", so it can never be mistaken for a real one. "Reset" clears the Forward test account and stops any Forward test algos that are on; it never touches live algos or real positions.
Positions on the chart and the Scalper
You do not have to switch to the positions screen to see a position. On the chart of any instrument you hold, a line marks the position's average price, and open orders and GTT triggers have lines of their own. From the position line you can exit the position; the order sheet opens for you to check and confirm, because the chart itself never sends an order. The same lines appear on the call and put charts of the Scalper, so an option trader can watch the position, the price and the stop on one screen.
When a broker does not answer
Brokers' systems are busy at the open and on expiry days, and sometimes a request goes unanswered. QuantPower treats that plainly:
- No answer is not "no positions". If a broker does not answer, the screen says so rather than showing an empty list.
- New orders are refused, not assumed safe. The risk checks need the position to measure a loss. Without it, new orders are refused until the broker answers.
- A signed-out broker is shown as signed out. A broker session ends every day. The broker's row shows "Sign-in needed", and live algos on that broker cannot enter until you sign in again.
When the broker answers again, the positions and their M2M come back as your broker holds them.
P&L history
The P&L history shows your realised profit and loss for each trading day and each month, worked out from your own fills. Fills are netted per broker, instrument and product in time order at average cost, and the profit or loss is booked on the day of the closing fill. You can choose a range of up to five years, filter by segment (equity, F&O, currency and commodity), and download the result as a CSV file.
Three rules keep it honest:
- It starts on the first day QuantPower stored your fills. Many brokers' trade books show only today's fills, so QuantPower stores each day's fills as it reads them. Nothing before the first stored day is estimated or filled in.
- A sale it cannot price is left out. If you sell shares you bought before the history began, there is no stored buy to measure against. That sale is left out and the day is marked as partial, rather than guessed.
- Charges are shown as your broker gives them. Where a broker's trade book does not include charges, they show as zero with a note saying so, and you should take them from your contract notes.
Your Forward test account has its own P&L history, from the start of the account, kept apart from real money.
Share Verified P&L
If you want to show your results to others, Share Verified P&L makes a public page and an image card of your profit and loss. You choose the date range, the segments, how your name appears and whether to show the number of trades. The figures themselves are worked out by the server from your broker fills and then frozen, so nobody, including you, can type them in or change them afterwards.
The card shows the range, the net P&L, the charges, the number of trading days and, if you chose it, the number of trades, with the words "Verified with your broker". It never shows your broker's name, the name of an algo or a strategy, or the word "returns", and it ends with the reminder that past P&L is not a guide to future results. Only real broker trades can be shared; a Forward test is never shareable. To take a share down, delete it, and its link stops working at once.
For tax and accounting, your broker's contract notes and tax P&L statement remain the official record.
A worked example: an options day with two brokers
Suppose you trade Nifty options at one broker and run an algo on Bank Nifty at another.
- In the morning, both brokers are connected and signed in. The positions screen shows nothing yet; your daily loss limit is ₹15,000 and Smart Exit is armed with a stop of ₹12,000 for the whole account.
- At 9:20 am your algo sells a Bank Nifty straddle at the second broker. Its card shows both legs filled.
- At 10:05 am you buy a Nifty call by hand at the first broker. It appears in the positions list under that broker.
- By noon the Bank Nifty straddle is down ₹7,000 and the Nifty call is down ₹3,500. Each looks manageable on its own. The account total, shown at the top, is down ₹10,500.
- At 12:40 pm the total reaches −₹12,000. Smart Exit stops the algo and squares off both positions, at both brokers.
Neither position alone came near the limit. The combined figure did. That is why the account-wide controls read every broker together.
A worked example: an end-of-day check
Before the close, run through the screen in the same order every day:
- Intraday positions: are any still open that you meant to close? Your broker will square them off near the close if you do not.
- Carried positions: do the quantities match your plan for tomorrow, and is there margin for them?
- Algo cards: has every algo that should have exited done so, and does any card show something it is waiting on?
- Pending orders and GTTs: cancel any that belong to positions you have closed.
- Today's P&L: note the day's result and compare it with your limit.
After the close, compare the quantities with your broker's own app. They should match exactly. If they do not, the order book will usually show why.
Monitoring on your phone
The phone app is the same QuantPower app in a phone-sized frame, so the positions screen, the algo cards, holdings, funds and the account-wide controls are all there. A phone suits monitoring better than trading: a glance at the day's total, a check that an algo's legs filled, and the kill switch at hand if something goes wrong. Notices for fired alerts, algo stops and fired signals arrive in the app while it is open.
Two habits help when you monitor from a phone. First, set the account-wide limits before you leave your desk, so that the phone is for watching, not for rescuing. Second, keep the second factor you use for the kill switch and Exit all on the same phone, so that you can use them in a hurry.
What to watch, by kind of trader
| Trader | Watch first | Then |
|---|---|---|
| Intraday option seller | The combined M2M of each strategy against the daily loss limit | Each short leg's premium against its stop |
| Option buyer | The premium of each position against your planned exit | Time left in the day, since premium decays |
| Algo trader | Each algo card: state, fills and anything it is waiting on | The account total against Smart Exit |
| Futures trader | M2M against your stop, and margin used | The futures premium over the index |
| Investor | Holdings value and the day's change | Funds and pledged collateral |
A monitoring routine
- Before the open: check carried positions, free margin and today's broker sign-in.
- After each entry: confirm every leg filled at the expected quantity.
- During the session: watch the combined P&L against your limit, not single legs.
- Before the close: confirm intraday positions closed and no stray stop orders remain.
- After the close: compare quantities with your broker's app; they should match exactly.
Common mistakes
- Watching legs, not strategies. A straddle is one trade. Judge it by its combined M2M.
- Forgetting the second broker. A loss at one broker and a gain at another can hide each other on two screens; QuantPower's total shows both.
- Closing an algo's position by hand while it runs. The algo may act on a leg you have already closed. Pause it first.
- Trusting the last price on a thin strike. The exit happens at the bid or ask, not at a trade from ten minutes ago.
- Leaving orders behind. A stop or a GTT for a closed position can open a new one later.
- Treating limits as guarantees. A gap, a halt or a rejected exit can make a loss larger than a limit.
- Checking only at the close. Margin and positions are checked by the rules during the day. A position that was fine at 10 am can need more margin by 2 pm.
- Ignoring the activity log. When an algo does something you did not expect, its log says what it did and why, in one line per event. Read it before you act.
Where position monitoring is going
The direction of travel is towards one view across everything a trader holds: several brokers, manual trades and algos, real money and Forward tests kept clearly apart. The rules point the same way, with margin and positions checked during the day rather than after it. The more a single screen shows, the more important it is that the figures on it come from the broker's own records and are never estimated.
Pricing
Position monitoring is free in QuantPower: positions, holdings, funds, P&L history and Share Verified P&L cost no tokens. Tokens (1 token = ₹1, GST extra) pay for live algos (200 per algo per 28 days), Forward tests, backtests beyond the free ones and AI use. See pricing.
Start with 500 free tokens
Connect your broker, build a strategy and test it on paper before a single live order goes out.
Frequently asked questions
Why does my P&L differ from my broker's app?
Prices update at slightly different moments, and some brokers measure the day's P&L on carried positions from the previous close rather than your entry price. Quantities should match exactly; small P&L gaps from timing are normal.
Can I see positions from two brokers together?
Yes. Connect both, and the positions screen shows each broker's positions with a combined total. The daily loss limit, Smart Exit and the kill switch use the combined figure.
What does Exit all do to my running algos?
It stops them first, so none re-enters, and then squares off every open position, or one segment if you choose. It needs your tap and your second factor.
How far back does my P&L history go?
To the first day QuantPower stored your fills. Earlier days are not estimated. You can ask for a range of up to five years at a time.
Can I share my P&L publicly?
Yes, with Share Verified P&L. The figures are worked out from your broker fills and frozen, and you can delete the share at any time. Forward test results cannot be shared.
Can I use the P&L history for my tax return?
Use your broker's contract notes and tax P&L statement for filing. The P&L history is for reviewing your trading, not a tax document.
Related guides
- How to manage open positions: the positions screen, step by step
- Lot size meaning: how lots set the size of an F&O position
- Kelly criterion position sizing: one way to size positions from your results
References
- Luca Pacioli, *Summa de arithmetica, geometria, proportioni et proportionalità* (1494), the first printed description of double-entry bookkeeping
- CME Group: history of the Chicago Board of Trade and its clearing corporation, founded 1925 (cmegroup.com)
- NSE Clearing Limited (formerly National Securities Clearing Corporation), incorporated 1995 (nseindia.com)
- SEBI, circular on the collection and reporting of margins by trading members, including peak margin, July 2020 (sebi.gov.in)
- QuantPower: positions, P&L history, Share Verified P&L and account-wide controls, from the app's code, checked 12 November 2026